
- Moving the Markets
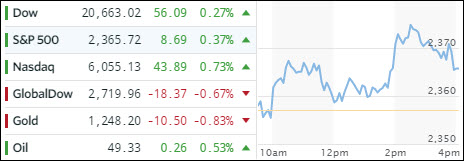
Despite the major indexes closing at their lows of yesterday’s session, downside follow through was contained, and a rebound rally materialized but faded into the close. Nevertheless, equities managed to squeeze out some modest gains despite a bloodbath in the Brazilian stock market with EWZ getting spanked at the tune of -16.33%. Ouch!
Not only did domestic stocks bounce back but the US dollar also showed signs of life with UUP gaining a modest +0.36% after getting absolutely hammered 4 days in a row, however, the dollar index is still down 1% for the week. Both assets benefited from former FBI chief Comey’s admission under oath that “obstructions of his investigations never happened.” Imagine my surprise…
Uncertainty remained in the banking sector but the Regional banking ETF (KRE) managed to gain +0.77% for the day. However, YTD, the entire sector looks weak with especially Goldman Sachs (GS) showing a loss of -9.91%.
Take a look at this chart, which compares YTD performance of Wall Street’s “darling banking stocks” vs. the banking index:
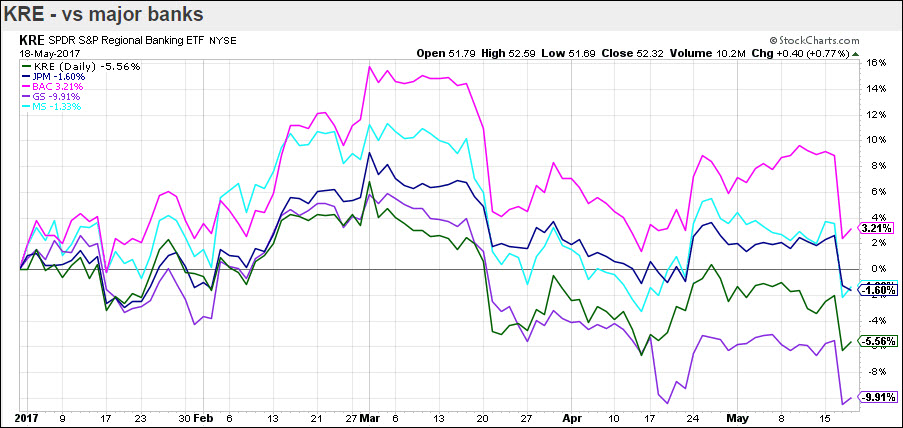
The banking sector peaked on March 1st but has been on s downhill slide ever since with only BofA (BAC) remaining in the green.
- ETFs in the Spotlight (updated for 2017)
In case you missed the announcement and description of this section, you can read it here again.
It features 10 broadly diversified and sector ETFs from my HighVolume list as posted every Saturday. Furthermore, they are screened for the lowest MaxDD% number meaning they have been showing better resistance to temporary sell offs than all others over the past year.
The below table simply demonstrates the magnitude with which some of the ETFs are fluctuating in regards to their positions above or below their respective individual trend lines (%M/A). A break below, represented by a negative number, shows weakness, while a break above, represented by a positive percentage, shows strength.
For hundreds of ETF choices, be sure to reference Thursday’s StatSheet.
Year to date, here’s how the 2017 candidates have fared so far:
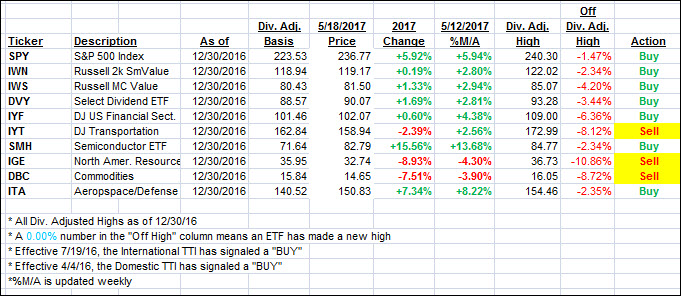
Again, the %M/A column above shows the position of the various ETFs in relation to their respective long term trend lines, while the trailing sell stops are being tracked in the “Off High” column. The “Action” column will signal a “Sell” once the -7.5% point has been taken out in the “Off High” column.
- Trend Tracking Indexes (TTIs)
Our Trend Tracking Indexes (TTIs) ended the day on a mixed note with the Domestic one advancing and the International one sliding.
Here’s how we closed 5/18/2017:
Domestic TTI: +2.97% (last close +2.78%)—Buy signal effective 4/4/2016
International TTI: +7.37% (last close +7.49%)—Buy signal effective 7/19/2016
Disclosure: I am obliged to inform you that I, as well as my advisory clients, own some of the ETFs listed in the above table. Furthermore, they do not represent a specific investment recommendation for you, they merely show which ETFs from the universe I track are falling within the guidelines specified.
Contact Ulli