
- Moving the Markets
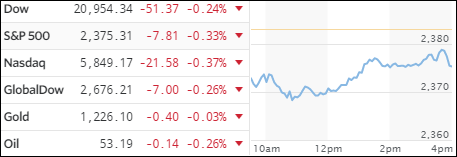
The major indexes started out the week on a negative note, rallied off the lows but did not manage to climb above the unchanged line. Setting the sour mood were news reports from N. Korea over the weekend that they had fired four ballistic missiles into the sea northwest of Japan. That was followed by tumultuous news from the Trump administration along with lack of details regarding his economic plans.
Add to that setbacks in filling his Cabinet posts and accusations of Obama wiretapping Trump power during the later part of the election campaign, and you have enough reasons to cast some questions as to the longevity of the post-election rally. For sure, once markets figure out that the Trump economic initiative, as well meaning as it may be, will not be executed in the expected time frame, you may see more weakness creep in.
One of the things discussed over the recent past was the question as to whether the entire Fed stimulus program of trillions of dollars over the past 8 years benefited Wall Street or Main Street. We just got the answer. Take a look at this chart:
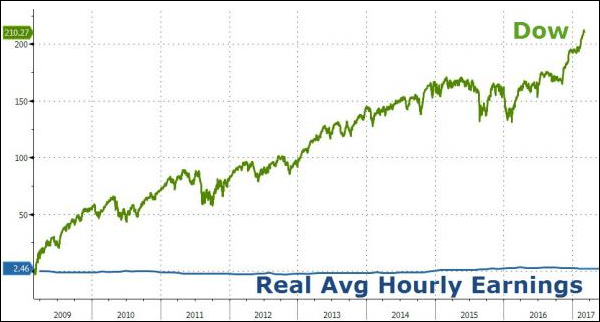
Real earnings are up 2.5% off the 2009 lows, the Dow is up 210%.
Chart courtesy of ZeroHedge
- ETFs in the Spotlight (updated for 2017)
In case you missed the announcement and description of this section, you can read it here again.
It features 10 broadly diversified and sector ETFs from my HighVolume list as posted every Saturday. Furthermore, they are screened for the lowest MaxDD% number meaning they have been showing better resistance to temporary sell offs than all others over the past year.
The below table simply demonstrates the magnitude with which some of the ETFs are fluctuating in regards to their positions above or below their respective individual trend lines (%M/A). A break below, represented by a negative number, shows weakness, while a break above, represented by a positive percentage, shows strength.
For hundreds of ETF choices, be sure to reference Thursday’s StatSheet.
Year to date, here’s how the 2017 candidates have fared so far:
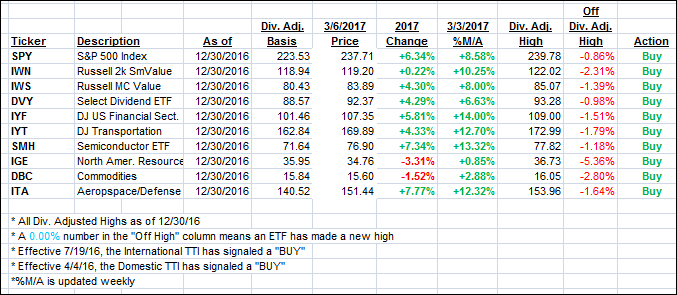
Again, the %M/A column above shows the position of the various ETFs in relation to their respective long term trend lines, while the trailing sell stops are being tracked in the “Off High” column. The “Action” column will signal a “Sell” once the -7.5% point has been taken out in the “Off High” column.
- Trend Tracking Indexes (TTIs)
Our Trend Tracking Indexes (TTIs) retreated as the markets continued to display weakness.
Here’s how we closed 3/6/2017:
Domestic TTI: +2.82% (last close +2.88%)—Buy signal effective 4/4/2016
International TTI: +5.40% (last close +5.53%)—Buy signal effective 7/19/2016
Disclosure: I am obliged to inform you that I, as well as my advisory clients, own some of the ETFs listed in the above table. Furthermore, they do not represent a specific investment recommendation for you, they merely show which ETFs from the universe I track are falling within the guidelines specified.
Contact Ulli