
- Moving the Markets
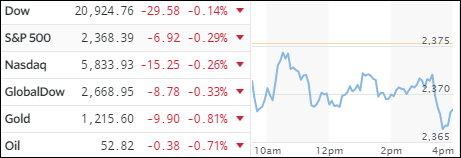
One look at the above chart and you’ll notice something that we have not seen in a long time. After the indexes spent all day below the unchanged line, the usual late afternoon ramp, which we’ve become accustomed to for a long time, did not materialize as stocks took a another dive but were saved from worse by a last minute upturn.
To me, things look sort of dicey right now. A week ago, the Fed announced via its various mouth pieces that a rate hike was imminent meaning it was forthcoming during their March 15 meeting, as Fed chief Yellen seemed to confirm during last Friday’s conference. While we all know that the Fed behind the curve with their rate hike effort, I think they are caught between a rock and a hard place.
According to the Atlanta Fed, the GDP forecast was revised from 1.8% last week to just 1.3% today. That is a huge drop, especially in view of the fact that this number was more than double, or 2.7%, just one month ago. This confirms what I have been pounding on for quite a while, namely that economic conditions are weakening and not strengthening as MSM reports almost daily. That condition would exactly be the wrong time for a rate hike.
If you consider that inflation officially has accelerated to 2.5%, you can see that GDP is actually in negative territory, which means the economy is shrinking and not expanding. Makes me wonder if stocks are finally catching on to this bitter reality? We’ll have to wait a while longer to be sure that the tide has actually turned; right now it looks as though this could be the proverbial canary in the coalmine.
- ETFs in the Spotlight (updated for 2017)
In case you missed the announcement and description of this section, you can read it here again.
It features 10 broadly diversified and sector ETFs from my HighVolume list as posted every Saturday. Furthermore, they are screened for the lowest MaxDD% number meaning they have been showing better resistance to temporary sell offs than all others over the past year.
The below table simply demonstrates the magnitude with which some of the ETFs are fluctuating in regards to their positions above or below their respective individual trend lines (%M/A). A break below, represented by a negative number, shows weakness, while a break above, represented by a positive percentage, shows strength.
For hundreds of ETF choices, be sure to reference Thursday’s StatSheet.
Year to date, here’s how the 2017 candidates have fared so far:
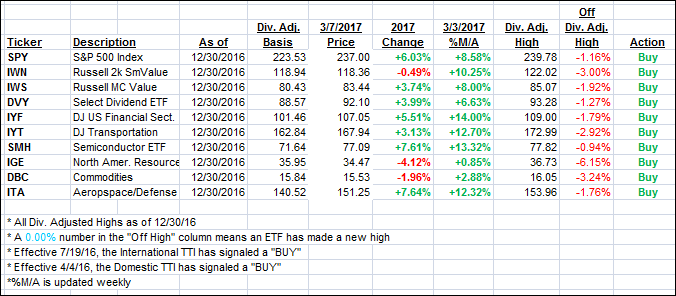
Again, the %M/A column above shows the position of the various ETFs in relation to their respective long term trend lines, while the trailing sell stops are being tracked in the “Off High” column. The “Action” column will signal a “Sell” once the -7.5% point has been taken out in the “Off High” column.
- Trend Tracking Indexes (TTIs)
Our Trend Tracking Indexes (TTIs) continued to slip as the major indexes remained in retreat mode.
Here’s how we closed 3/7/2017:
Domestic TTI: +2.62% (last close +2.82%)—Buy signal effective 4/4/2016
International TTI: +4.98% (last close +5.40%)—Buy signal effective 7/19/2016
Disclosure: I am obliged to inform you that I, as well as my advisory clients, own some of the ETFs listed in the above table. Furthermore, they do not represent a specific investment recommendation for you, they merely show which ETFs from the universe I track are falling within the guidelines specified.
Contact Ulli