
ETF Tracker StatSheet
Market Commentary
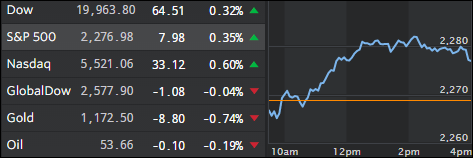
Dow 19,963.80
- Moving the Markets
The assault at the Dow 20k marker continued but fell short once again. Given that we are in a manipulated market environment, I am pretty sure that we will conquer that milestone prior to the change in administrations on January 20th. After that, it’s anybody’s guess as to what will happen next.
The Nasdaq and S&P 500 reached record highs, but the advance was not broad based with small-caps down and mid-caps barely above the unchanged line. The big boost came from
Apple sporting a +1.11% gain. We’re still in post-election hope-mode that Trump, once in office, will be able to follow through and implement his campaign promises. Let’s see how hope and reality come together after inauguration day.
Today’s jobs report was not impressive as 156k jobs, less than expected, were added with the bulk going to nurses, waiters and waste cleaners, as ZH reported. Wage growth rose just 2.5%, which is far below the 4% it was when the unemployment rate last hit 4.7%.
Factory orders plunged in November and, when viewed YoY, they have declined now for the 23rd month out of the last 25. Hardly a reassuring sign of a growing economy…
- ETFs in the Spotlight (updated for 2017)
In case you missed the announcement and description of this section, you can read it here again.
It features 10 broadly diversified and sector ETFs from my HighVolume list as posted every Saturday. Furthermore, they are screened for the lowest MaxDD% number meaning they have been showing better resistance to temporary sell offs than all others over the past year.
The below table simply demonstrates the magnitude with which some of the ETFs are fluctuating in regards to their positions above or below their respective individual trend lines (%M/A). A break below, represented by a negative number, shows weakness, while a break above, represented by a positive percentage, shows strength.
For hundreds of ETF choices, be sure to reference Thursday’s StatSheet.
Year to date, here’s how the 2017 candidates have fared so far:
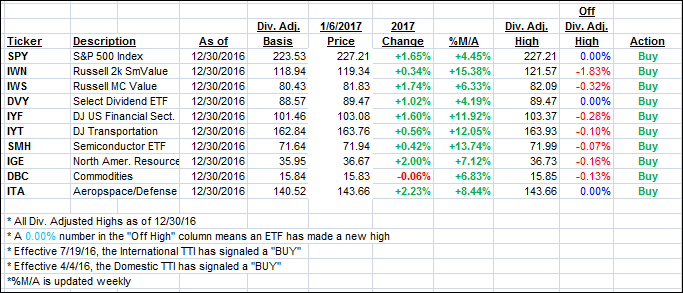
Again, the %M/A column above shows the position of the various ETFs in relation to their respective long term trend lines, while the trailing sell stops are being tracked in the “Off High” column. The “Action” column will signal a “Sell” once the -7.5% point has been taken out in the “Off High” column.
- Trend Tracking Indexes (TTIs)
Our Trend Tracking Indexes (TTIs) moved deeper into bullish territory with the major indexes gaining during this first trading week of 2017.
Here’s how we closed 1/6/2017:
Domestic TTI: +1.60% (last Friday +0.91%)—Buy signal effective 4/4/2016
International TTI: +3.51% (last Friday +1.80%)—Buy signal effective 7/19/2016
Disclosure: I am obliged to inform you that I, as well as my advisory clients, own some of the ETFs listed in the above table. Furthermore, they do not represent a specific investment recommendation for you, they merely show which ETFs from the universe I track are falling within the guidelines specified.
————————————————————-
READER Q & A FOR THE WEEK
All Reader Q & A’s are listed at our web site!
Check it out at:
https://theetfbully.com/questions-answers/
———————————————————-
WOULD YOU LIKE TO HAVE YOUR INVESTMENTS PROFESSIONALLY MANAGED?
Do you have the time to follow our investment plans yourself? If you are a busy professional who would like to have his portfolio managed using our methodology, please contact me directly or get more details at:
https://theetfbully.com/personal-investment-management/
———————————————————
Back issues of the ETF/No Load Fund Tracker are available on the web at:
https://theetfbully.com/newsletter-archives/
Contact Ulli