
1. Moving the Markets
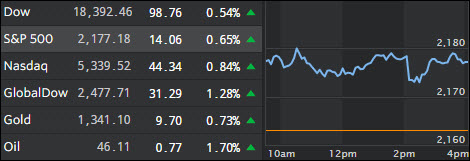
Thanks to the Fed’s decision of not raising rates and thereby keeping the financial markets happy, the computer algos went wild for a second day in a row with the major indexes, along with gold and silver, benefitting by closing higher although on abysmal volume. Never mind that US growth was forecasted to records lows, all that matters was that the stock market got pushed higher no matter what the constantly deteriorating economic data points are saying.
The Bloomberg’s Consumer Comfort Index plunged to the lowest since the end of last year as existing home sales, after last month’s unexpected dramatic drop of 3.4%, showed an annual decline of 1.64%.
Analyzing the current state of affairs accurately and succinctly was CNBC’s Dennis Gartman with this remark:
We are, it seems to us, entering the period we shall call the “Zimbabwe-isation” of the global capital markets and we say that with all sincerity… and requisite trepidation… recalling that the Zimbabwe stock market led the world to the upside several years ago as the central bank there lost all control of its money supply and created a massive, rampant inflation that sent the Zimbabwe dollar into oblivion but sent the Zimbabwe stock market soaring at the same time.
The process was ill-advised and everyone everywhere knew that eventually the structure would collapse and that share prices would eventually plunge; but while the process was being played out one had no choice but to play the Zimbabwe stock market from the long side. We are there now; it seems to us, in the stock markets of the advanced world, with the monetary authorities continuing their expansionary policies and with “money” fleeing into the stock markets.
This will end badly of course. These things always do, but until they end… until the music finally stops… the game has to be played and the music, as it plays, has to be enjoyed.
2. ETFs in the Spotlight
In case you missed the announcement and description of this section, you can read it here again.
It features 10 broadly diversified ETFs from my HighVolume list as posted every Monday. Furthermore, they are screened for the lowest MaxDD% number meaning they have been showing better resistance to temporary sell offs than all others over the past year.
Here are the 10 candidates:
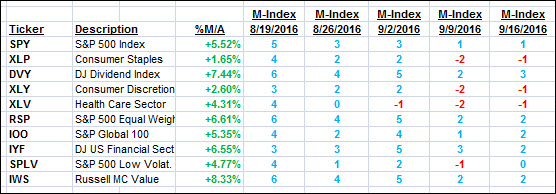
The above table simply demonstrates the magnitude with which some of the ETFs are fluctuating in regards to their positions above or below their respective individual trend lines (%M/A). A break below, represented by a negative number, shows weakness, while a break above, represented by a positive percentage, shows strength.
For hundreds of ETF choices, be sure to reference Thursday’s StatSheet.
Year to date, here’s how the above candidates have fared so far:
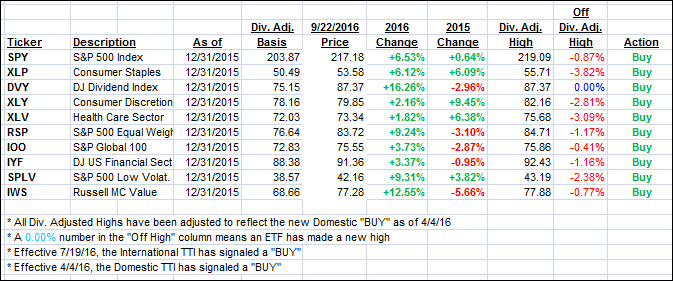
Again, the first table above shows the position of the various ETFs in relation to their respective long term trend lines (%M/A), while the second one tracks their trailing sell stops in the “Off High” column. The “Action” column will signal a “Sell” once the -7.5% point has been taken out in the “Off High” column.
3. Trend Tracking Indexes (TTIs)
Our Trend Tracking Indexes (TTIs) followed the major indexes higher with the International one taking a leap deeper into bullish territory.
Here’s how we closed 9/22/2016:
Domestic TTI: +2.84% (last close +2.45%)—Buy signal effective 4/4/2016
International TTI: +5.69% (last close +4.79%)—Buy signal effective 7/19/2016
Disclosure: I am obliged to inform you that I, as well as my advisory clients, own some of the ETFs listed in the above table. Furthermore, they do not represent a specific investment recommendation for you, they merely show which ETFs from the universe I track are falling within the guidelines specified.
Contact Ulli