
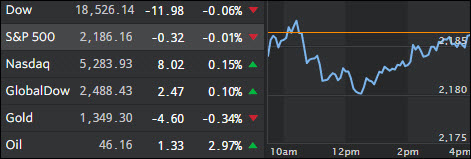
1. Moving the Markets
Stocks ended mixed today, but the Nasdaq notched another record closing high after the big Apple “unveiling” event, in which the gadget maker revealed the latest version of its popular iPhone, the iPhone 7. While all the spec upgrades are tempting, the real winner today was Nintendo (NTDOY).
Apparently, Nintendo plans to release a version of its co-owned Pokemon Go augmented reality game to the Apple Watch and a running style game using Mario Bros. characters to the iPhone called “Super Mario Run.” Shares of Nintendo’s U.S. listed shares jumped 29% to $36.32 a share today after the gaming pioneer said during the Apple conference it would bring several titles to Apple’s various mobile platforms. The massive rise in Nintendo’s shares stands out especially given Apple’s (AAPL) own stock is stagnant, even after the announcement. Shares of Apple are up roughly 2% this year while the S&P 500 has risen nearly 9%.
In economic news, we heard today that the U.S. economy expanded modestly in July and August. Manufacturing activity picked up slightly, retail sales were flat and payrolls increased moderately in a tight labor market, the Federal Reserve said today.
2. ETFs in the Spotlight
In case you missed the announcement and description of this section, you can read it here again.
It features 10 broadly diversified ETFs from my HighVolume list as posted every Monday. Furthermore, they are screened for the lowest MaxDD% number meaning they have been showing better resistance to temporary sell offs than all others over the past year.
Here are the 10 candidates:
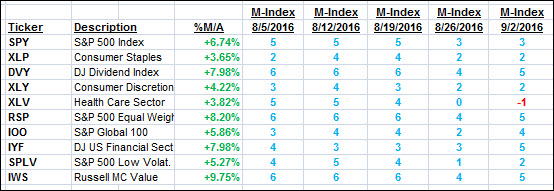
The above table simply demonstrates the magnitude with which some of the ETFs are fluctuating in regards to their positions above or below their respective individual trend lines (%M/A). A break below, represented by a negative number, shows weakness, while a break above, represented by a positive percentage, shows strength.
For hundreds of ETF choices, be sure to reference Thursday’s StatSheet.
Year to date, here’s how the above candidates have fared so far:
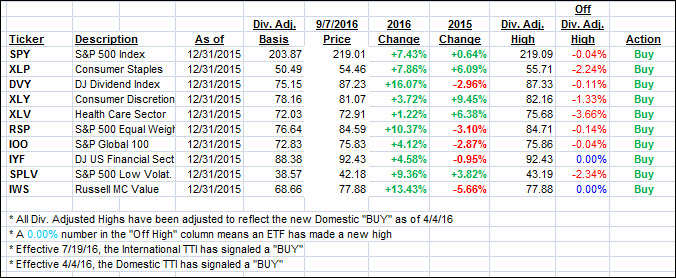
Again, the first table above shows the position of the various ETFs in relation to their respective long term trend lines (%M/A), while the second one tracks their trailing sell stops in the “Off High” column. The “Action” column will signal a “Sell” once the -7.5% point has been taken out in the “Off High” column.
3. Trend Tracking Indexes (TTIs)
Our Trend Tracking Indexes (TTIs) managed to inch up despite the S&P 500 ending just about unchanged.
Here’s how we closed 9/7/2016:
Domestic TTI: +3.13% (last close +3.09%)—Buy signal effective 4/4/2016
International TTI: +6.11% (last close +5.97%)—Buy signal effective 7/19/2016
Disclosure: I am obliged to inform you that I, as well as my advisory clients, own some of the ETFs listed in the above table. Furthermore, they do not represent a specific investment recommendation for you, they merely show which ETFs from the universe I track are falling within the guidelines specified.
Contact Ulli