
1. Moving the Markets
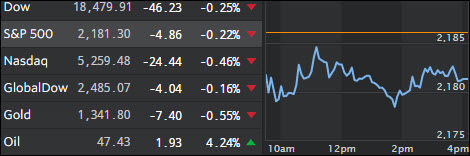
U.S. stocks slipped today as traders digested the decision by the ECB to keep interest rates unchanged and looked for fresh catalysts, as in more Fed stimulus, to propel the market higher. As analysts had expected, the European Central Bank decided to keep its key deposit rate unchanged at -0.4%, but also said it would continue to buy 80 billion in euros worth of bonds each month at least until March 2017.
In auto news, Ford (F) is expanding a recall that entails an additional 1.5 million more vehicles that need to be brought into dealers to fix doors that can “fly open” while the vehicle is being driven. The new vehicles included in the latest recall include the 2013 to 2015 Ford C-MAX and Ford Escape, 2012 to 2015 Ford Focus, 2015 Ford Mustang and Lincoln MKC and 2014 to 2016 Ford Transit Connect. The automaker will obviously take a hit in Q3, but is taking action to remedy the situation.
In the world of retail clothing, shares of Pier 1 Imports (PIR) fell 12% today after the retailer’s stock was downgraded over performance concerns and the departure of its CEO. In a preliminary earnings report that Pier 1 issued yesterday, the company said its net sales for the Q2 fell about 6.7% compared to the same period in 2015.
2. ETFs in the Spotlight
In case you missed the announcement and description of this section, you can read it here again.
It features 10 broadly diversified ETFs from my HighVolume list as posted every Monday. Furthermore, they are screened for the lowest MaxDD% number meaning they have been showing better resistance to temporary sell offs than all others over the past year.
Here are the 10 candidates:
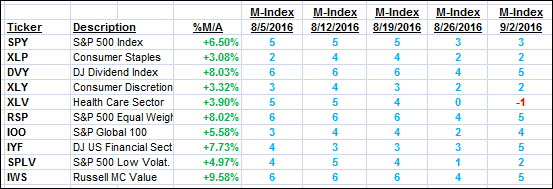
The above table simply demonstrates the magnitude with which some of the ETFs are fluctuating in regards to their positions above or below their respective individual trend lines (%M/A). A break below, represented by a negative number, shows weakness, while a break above, represented by a positive percentage, shows strength.
For hundreds of ETF choices, be sure to reference Thursday’s StatSheet.
Year to date, here’s how the above candidates have fared so far:
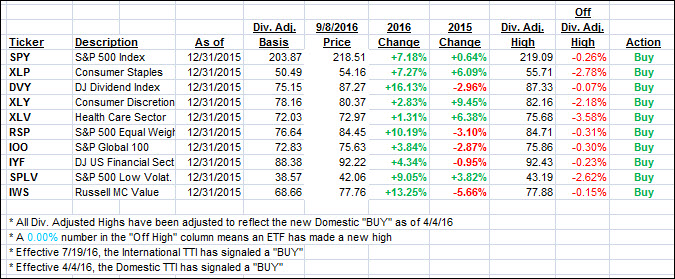
Again, the first table above shows the position of the various ETFs in relation to their respective long term trend lines (%M/A), while the second one tracks their trailing sell stops in the “Off High” column. The “Action” column will signal a “Sell” once the -7.5% point has been taken out in the “Off High” column.
3. Trend Tracking Indexes (TTIs)
Our Trend Tracking Indexes (TTIs) headed south as today’s market direction was uncertain with a downward bias.
Here’s how we closed 9/8/2016:
Domestic TTI: +2.85% (last close +3.3%)—Buy signal effective 4/4/2016
International TTI: +5.86% (last close +6.11%)—Buy signal effective 7/19/2016
Disclosure: I am obliged to inform you that I, as well as my advisory clients, own some of the ETFs listed in the above table. Furthermore, they do not represent a specific investment recommendation for you, they merely show which ETFs from the universe I track are falling within the guidelines specified.
Contact Ulli