
1. Moving the Markets
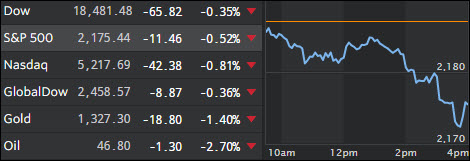
Time flies by, as we all know. It was almost a year ago that stocks plunged amid worries regarding falling oil prices and the uncertainty about China’s economic growth. Well, a year has passed and not much has changed. The price of oil remains under $50 per barrel and China’s growth continues to slow.
At the moment, there is not a lot of market-moving info to get investors excited. Q2 earnings season (which better than expected, despite the S&P 500 suffering its fourth straight quarter of negative profit growth) is winding down. And there was only one key economic data point released today: Existing home sales, which disappointed, with sales down 3.2% in July to an annualized rate of 5.39 million. Economists were expecting sales at an annual rate of 5.5 million units, down from 5.57 million units in June.
Precious metals had a rough morning when one of the big players, possibly in need of raising cash, dumped $1.5 billion of gold futures contracts within a 10 minute period, which took the starch out of any upward momentum. Silver and gold miners joined in the misery and closed lower as well.
Wall Street is eagerly awaiting a key speech on monetary policy by Fed Chair Yellen on Friday at a closely watched central bankers meeting in Jackson Hole, Wyoming. Investors will be listening to any clues from Yellen regarding the timing of the next interest rate hike.
The Fed last hiked rates back in December, which was their first rate increase in nearly a decade and moved rates off of zero. Will the jawboning be just that or will an actual decision be made? My guess is that based on economic realities, the Fed is stuck between a rock and a hard place and can’t afford even a meager 0.25% rate hike.
2. ETFs in the Spotlight
In case you missed the announcement and description of this section, you can read it here again.
It features 10 broadly diversified ETFs from my HighVolume list as posted every Monday. Furthermore, they are screened for the lowest MaxDD% number meaning they have been showing better resistance to temporary sell offs than all others over the past year.
Here are the 10 candidates:
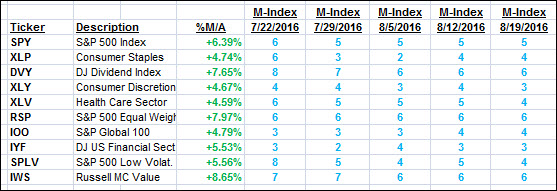
The above table simply demonstrates the magnitude with which some of the ETFs are fluctuating in regards to their positions above or below their respective individual trend lines (%M/A). A break below, represented by a negative number, shows weakness, while a break above, represented by a positive percentage, shows strength.
For hundreds of ETF choices, be sure to reference Thursday’s StatSheet.
Year to date, here’s how the above candidates have fared so far:
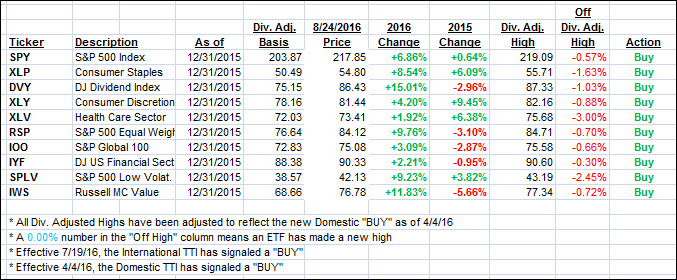
Again, the first table above shows the position of the various ETFs in relation to their respective long term trend lines (%M/A), while the second one tracks their trailing sell stops in the “Off High” column. The “Action” column will signal a “Sell” once the -7.5% point has been taken out in the “Off High” column.
3. Trend Tracking Indexes (TTIs)
Our Trend Tracking Indexes (TTIs) slipped as oil and weak economic data pulled the major indexes lower.
Here’s how we closed 8/24/2016:
Domestic TTI: +2.95% (last close +3.19%)—Buy signal effective 4/4/2016
International TTI: +4.81% (last close +5.08%)—Buy signal effective 7/19/2016
Disclosure: I am obliged to inform you that I, as well as my advisory clients, own some of the ETFs listed in the above table. Furthermore, they do not represent a specific investment recommendation for you, they merely show which ETFs from the universe I track are falling within the guidelines specified.
Contact Ulli