
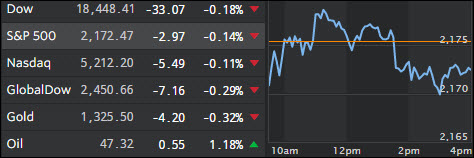
1. Moving the Markets
Heading into Thursday’s trading session, all three major U.S. stock indexes were less than 1% below their record closing highs. Equities dipped slightly lower today though ahead of another much anticipated speech due from Janet Yellen tomorrow in Jackson Hole, WY. Many believe that Yellen wants to avoid market turbulence, so a surprise policy shift toward a sooner-than-expected rate hike is unlikely.
As usual, the speech is being chalked up as must-see TV, but Federal Reserve chair Janet Yellen’s address Friday may not offer many (or even any) surprises at all. Yellen is expected to outline what “tools” the Fed has to fight the next battle or crisis that may come up as it comes to grips with the new world of slow growth and low rates. However, no matter how much lipstick you want to put on that pig, the only “tool” the Fed has at its disposal is to create more debt no matter what they call it. That’s it!
On the individual stock front, shares of drug maker Mylan (MYL) were up in early trading after the company responded to the controversy surrounding a sharp price hike on its EpiPen by offering consumers a rebate in the form of a savings coupon that the company says will cut the cost of the drug in half. Shares pulled back late in the day low and closed down about 0.8%.
2. ETFs in the Spotlight
In case you missed the announcement and description of this section, you can read it here again.
It features 10 broadly diversified ETFs from my HighVolume list as posted every Monday. Furthermore, they are screened for the lowest MaxDD% number meaning they have been showing better resistance to temporary sell offs than all others over the past year.
Here are the 10 candidates:
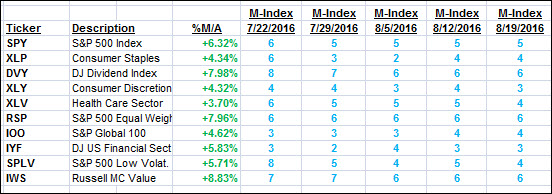
The above table simply demonstrates the magnitude with which some of the ETFs are fluctuating in regards to their positions above or below their respective individual trend lines (%M/A). A break below, represented by a negative number, shows weakness, while a break above, represented by a positive percentage, shows strength.
For hundreds of ETF choices, be sure to reference Thursday’s StatSheet.
Year to date, here’s how the above candidates have fared so far:
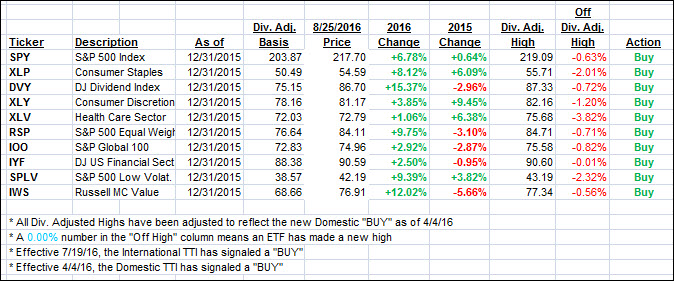
Again, the first table above shows the position of the various ETFs in relation to their respective long term trend lines (%M/A), while the second one tracks their trailing sell stops in the “Off High” column. The “Action” column will signal a “Sell” once the -7.5% point has been taken out in the “Off High” column.
3. Trend Tracking Indexes (TTIs)
Our Trend Tracking Indexes (TTIs) pulled back again as the major indexes were directionless in anticipation of Fed chief Yellen’s announcement on interest rates tomorrow.
Here’s how we closed 8/25/2016:
Domestic TTI: +2.88% (last close +2.95%)—Buy signal effective 4/4/2016
International TTI: +4.53% (last close +4.81%)—Buy signal effective 7/19/2016
Disclosure: I am obliged to inform you that I, as well as my advisory clients, own some of the ETFs listed in the above table. Furthermore, they do not represent a specific investment recommendation for you, they merely show which ETFs from the universe I track are falling within the guidelines specified.
Contact Ulli