
1. Moving the Markets
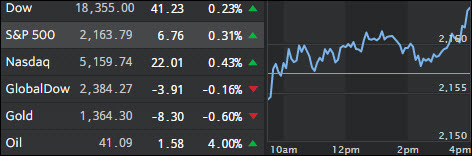
Stocks turned the boat around today, which entailed the Dow snapping a seven-session losing streak. The market had lost momentum over the past week, as shares have been weighed down by a fourth straight quarter of negative profit growth for the S&P 500, above-average valuations and a renewed dip in oil prices. U.S.-produced crude had tumbled more than 20% from its recent high and below $40 per barrel, before jumping back up above the $40 mark today.
Despite the recent soft patch for stocks, the Dow is down just 1.5% from its July 20 all-time high and remains up 5.1% on the year. Similarly, the S&P 500 is down less than 1% from its July 22 record and is up 5.5% in 2016.
Wall Street also got more good news on the jobs front. Private employers added 179,000 jobs in July, topping expectations and lifting hopes that the government’s July employment report set for release Friday will also come in solid.
In earnings news, Telsa Motors (TSLA) showed the continued strain of building an electric automaker with even grander ambitions, announcing second quarter losses that did not meet Wall Street expectations. The company reported losing $2.09 a share, or $293 million.
2. ETFs in the Spotlight
In case you missed the announcement and description of this section, you can read it here again.
It features 10 broadly diversified ETFs from my HighVolume list as posted every Monday. Furthermore, they are screened for the lowest MaxDD% number meaning they have been showing better resistance to temporary sell offs than all others over the past year.
Here are the 10 candidates:
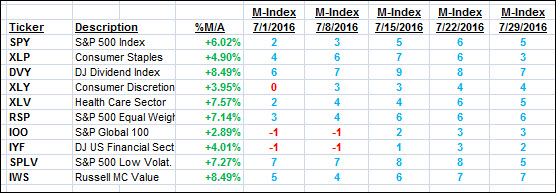
The above table simply demonstrates the magnitude with which some of the ETFs are fluctuating in regards to their positions above or below their respective individual trend lines (%M/A). A break below, represented by a negative number, shows weakness, while a break above, represented by a positive percentage, shows strength.
For hundreds of ETF/Mutual fund choices, be sure to reference Thursday’s StatSheet.
Year to date, here’s how the above candidates have fared so far:
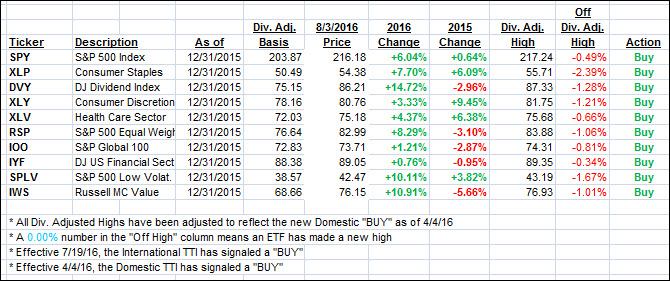
Again, the first table above shows the position of the various ETFs in relation to their respective long term trend lines (%M/A), while the second one tracks their trailing sell stops in the “Off High” column. The “Action” column will signal a “Sell” once the -7.5% point has been taken out in the “Off High” column.
3. Trend Tracking Indexes (TTIs)
Both of our Trend Tracking Indexes (TTIs) edged higher as the major indexes managed a last hour push into positive territory after meandering for most of the day.
Here’s how we closed 8/3/2016:
Domestic TTI: +2.94% (last close +2.78%)—Buy signal effective 4/4/2016
International TTI: +2.50% (last close +2.30%)—Buy signal effective 7/19/2016
Disclosure: I am obliged to inform you that I, as well as my advisory clients, own some of the ETFs listed in the above table. Furthermore, they do not represent a specific investment recommendation for you, they merely show which ETFs from the universe I track are falling within the guidelines specified.
Contact Ulli