
1. Moving the Markets
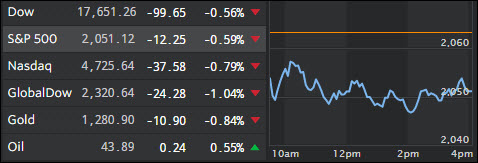
U.S. stocks fell again, which is in line with the trend for the week thus far as for a long overdue change bad news is recognized as bad news. Investors are pondering weaker-than-expected readings on job creation in the private sector last month, mixed with good news on the services sector of the economy. The slide today extended yesterday’s sell-off, which has pushed the Dow to a three-week low.
In economic news, payroll processor ADP said private employers created 156,000 new jobs in April, far below expectations of close to 200,000. The weak number raised concerns that the April jobs report released Friday by the government might also fall shy of the 200,000 estimate. Growth fears and overseas news also weighed on equities. Investor sentiment was hurt when a key Chinese manufacturing data point for April came in weak, causing growth fears to resurface once again.
On the plus side, the Institute for Supply Management’s April reading on the non-manufacturing part of the economy, or services sector, came in strong at 55.7, topping estimates of 54.8. March factory orders also topped analysts’ expectations, rising 1.1%. The nation’s trade deficit also narrowed in March to $40.4 billion.
A new worry-point for Wall Street is the recent strength in foreign currencies vs. the dollar. The yen is trading at an 18-month high vs.the greenback, which is likely to put further pressure on Japanese exporters and adding to angst over growth. The euro has also been climbing, putting a strain on eurozone firms that sell stuff abroad. We are also dealing with a stalled economy, with first-quarter GDP coming in below expectations at 0.5%.
2. ETFs in the Spotlight
In case you missed the announcement and description of this section, you can read it here again.
It features 10 broadly diversified ETFs from my HighVolume list as posted every Monday. Furthermore, they are screened for the lowest MaxDD% number meaning they have been showing better resistance to temporary sell offs than all others over the past year.
Here are the 10 candidates:
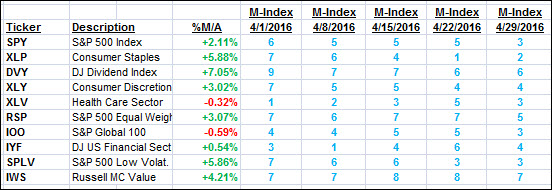
The above table simply demonstrates the magnitude with which some of the ETFs are fluctuating in regards to their positions above or below their respective individual trend lines (%M/A). A break below, represented by a negative number, shows weakness, while a break above, represented by a positive percentage, shows strength.
For hundreds of ETF/Mutual fund choices, be sure to reference Thursday’s StatSheet.
Year to date, here’s how the above candidates have fared so far:
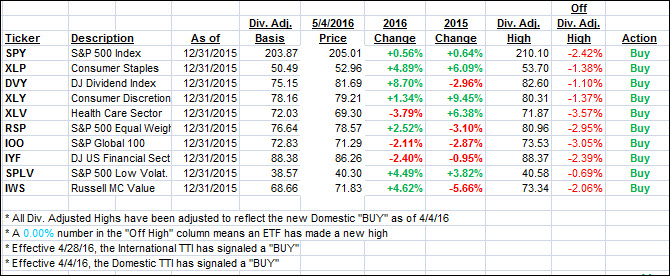
Again, the first table above shows the position of the various ETFs in relation to their respective long term trend lines (%M/A), while the second one tracks their trailing sell stops in the “Off High” column. The “Action” column will signal a “Sell” once the -7.5% point has been taken out in the “Off High” column.
3. Trend Tracking Indexes (TTIs)
Our Domestic Trend Tracking Index (TTI) retreated again but remains on the bullish side of its trend line. The International one on the other hand, sank deeper into bearish territory. Good thing we did not take any positions in that arena. I will watch for more bearish confirmation before declaring this short-lived Buy cycle to be over.
Here’s how we ended up:
Domestic TTI: +1.03% (last close +1.24%)—Buy signal effective 4/4/2016
International TTI: -1.04% (last close -0.40%)—Buy signal effective 4/28/2016
Disclosure: I am obliged to inform you that I, as well as advisory clients of mine, own some of these listed ETFs. Furthermore, they do not represent a specific investment recommendation for you, they merely show which ETFs from the universe I track are falling within the guidelines specified.
Contact Ulli