
1. Moving the Markets
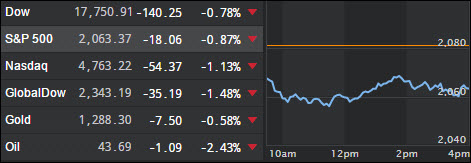
U.S. stocks fell on Tuesday, following weak manufacturing data from China. Stocks reversed course and gave back all of the solid gains achieved on Monday.
The lack of economic growth, here in the U.S., which I have alluded to in the past, continues to put a damper on financial markets. U.S. GDP, for example, logged a weak 0.5% in the initial read for Q1. Also, talk of a U.S. economy in so-called stall speed, coupled with contracting corporate earnings and continued uncertainty over central bank policy moves around the world, has held U.S. stocks back recently.
In stock specific news, iPhone maker Apple (APPL) was hoping to break an eight session losing streak, its longest since 1998. Apple shares are down 11% so far in 2016 and have tumbled nearly 13% in its eight-session slide. In early trading, Apple shares jumped 1.9% to $95.41.
On the earnings front, drug-maker Pfizer (PFE) topped quarterly earnings forecasts by 12 cents. Its shares were up sharply, rallying 3.2%.
2. ETFs in the Spotlight
In case you missed the announcement and description of this section, you can read it here again.
It features 10 broadly diversified ETFs from my HighVolume list as posted every Monday. Furthermore, they are screened for the lowest MaxDD% number meaning they have been showing better resistance to temporary sell offs than all others over the past year.
Here are the 10 candidates:
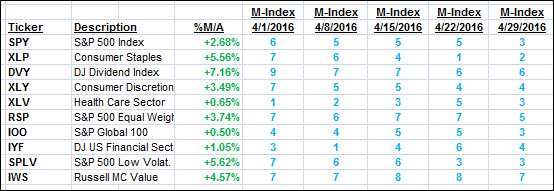
The above table simply demonstrates the magnitude with which some of the ETFs are fluctuating in regards to their positions above or below their respective individual trend lines (%M/A). A break below, represented by a negative number, shows weakness, while a break above, represented by a positive percentage, shows strength.
For hundreds of ETF/Mutual fund choices, be sure to reference Thursday’s StatSheet.
Year to date, here’s how the above candidates have fared so far:
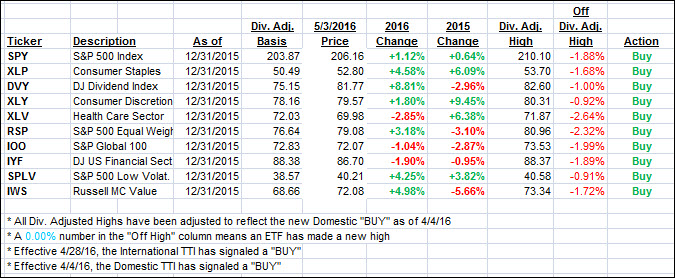
Again, the first table above shows the position of the various ETFs in relation to their respective long term trend lines (%M/A), while the second one tracks their trailing sell stops in the “Off High” column. The “Action” column will signal a “Sell” once the -7.5% point has been taken out in the “Off High” column.
3. Trend Tracking Indexes (TTIs)
Our Domestic Trend Tracking Index (TTI) pulled back while the International one dropped below its trend line. Again, I will wait for further downside confirmation before considering this recent International “Buy” a whip-saw signal.
Here’s how we closed:
Domestic TTI: +1.24% (last close +1.80%)—Buy signal effective 4/4/2016
International TTI: -0.40% (last close +0.81%)—Buy signal effective 4/28/2016
Disclosure: I am obliged to inform you that I, as well as advisory clients of mine, own some of these listed ETFs. Furthermore, they do not represent a specific investment recommendation for you, they merely show which ETFs from the universe I track are falling within the guidelines specified.
Contact Ulli