
1. Moving the Markets
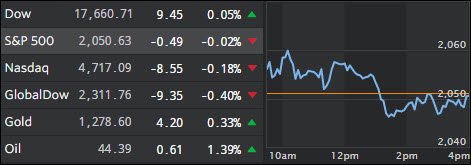
Stocks struggled to stay above ground today. Early morning movement was positive, however, roller coasters go up and they go down. The Dow was the only major index to finish in positive territory on the day.
U.S. produced crude prices are on the rise again as raging forest fires in Alberta, a key oil sands region, caused production shortages. Crude was up 0.8% to $44.16 after rising as high as $46.07 earlier in the trading day. S&P’s energy sector is up 0.5%, tracking the rise in crude prices to the upside.
Wall Street is looking ahead to the April jobs report, which is in queue for Friday at 8:30 a.m. ET. Analysts are forecasting that 200,000 new jobs were created last month, but a weaker-than-expected reading on new jobs created in the private sector is provoking investors to expect a lower number. Before Thursday’s opening bell, the number of Americans lining up for first-time jobless benefits jumped more than expected to 274,000, up 17,000 from the prior week.
Tesla shares dropped 5% today as investors expressed skepticism over the company’s plan to accelerate and ramp up deliveries of its electric vehicles. The stock has been volatile recently. Yesterday, shares jumped as much as 7% in after-hours trading after they announced Q1 earnings that showed a loss just slightly less than the Street forecast.
2. ETFs in the Spotlight
In case you missed the announcement and description of this section, you can read it here again.
It features 10 broadly diversified ETFs from my HighVolume list as posted every Monday. Furthermore, they are screened for the lowest MaxDD% number meaning they have been showing better resistance to temporary sell offs than all others over the past year.
Here are the 10 candidates:
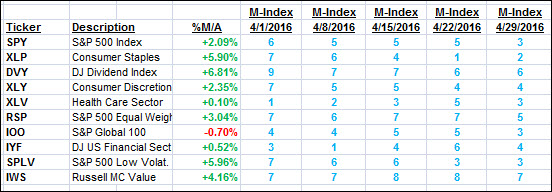
The above table simply demonstrates the magnitude with which some of the ETFs are fluctuating in regards to their positions above or below their respective individual trend lines (%M/A). A break below, represented by a negative number, shows weakness, while a break above, represented by a positive percentage, shows strength.
For hundreds of ETF/Mutual fund choices, be sure to reference Thursday’s StatSheet.
Year to date, here’s how the above candidates have fared so far:
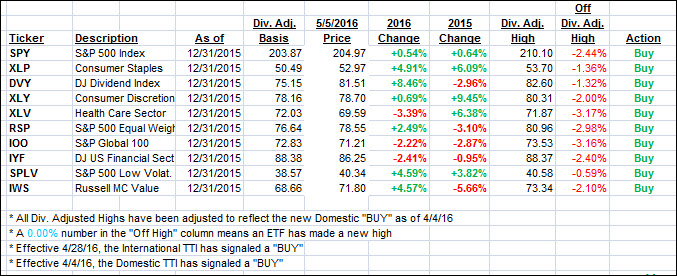
Again, the first table above shows the position of the various ETFs in relation to their respective long term trend lines (%M/A), while the second one tracks their trailing sell stops in the “Off High” column. The “Action” column will signal a “Sell” once the -7.5% point has been taken out in the “Off High” column.
3. Trend Tracking Indexes (TTIs)
Our Domestic Trend Tracking Index (TTI) changed only by a tad as the major indexes closed about unchanged. I expect to to see more of a move tomorrow either up or down depending on the outcome of the jobs report.
Here’s how we closed this Thursday:
Domestic TTI: +1.05% (last close +1.03%)—Buy signal effective 4/4/2016
International TTI: -1.17% (last close -1.04%)—Buy signal effective 4/28/2016
Disclosure: I am obliged to inform you that I, as well as advisory clients of mine, own some of these listed ETFs. Furthermore, they do not represent a specific investment recommendation for you, they merely show which ETFs from the universe I track are falling within the guidelines specified.
Contact Ulli