
1. Moving the Markets
As I was scanning the early news on MarketWatch, I cam across the headline “Wall Street gains as weak data spurs stimulus,” which was later removed and replaced with “Wall Street surges as data points to economic recovery” confirming that according to MSM bad news is good news and good news can be great news—all at the same time.
However, nothing mattered, despite the worst global macro data in some 4 years as timely verbal assists about possible interventions from ECBs Draghi and NY Fed President Dudley lit some fire under the major indexes.
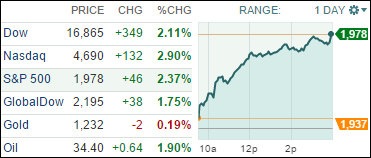
That was enough and March came in like a bull in a China shop for with U.S. stocks up sharply adding fuel to an early rally on China’s latest stimulus move. All major indexes gained more than 2.1%.
The initial boost came after China freed more money for lending by lowering the amount commercial lenders must hold in reserve in a move to shore up slowing economic growth. I can’t see how this would be a good thing given the massive amounts of non-performing loans in the system other than to lift the stock markets temporarily.
Domestically, bank and tech stocks led the charge. Bank of America (BAC) rose 5% to $13.15 and JPMorgan Chase (JPM) gained 4.3% percent, to $58.72, pacing the gains among financial stocks.
Shares of Valeant (VRX) took a hit today. The company is under investigation from the SEC, but they are denying suggestions from a short-seller that they used Philidor and other specialty pharmacies to commit accounting fraud.
2. ETFs in the Spotlight
In case you missed the announcement and description of this section, you can read it here again.
It features 10 broadly diversified ETFs from my HighVolume list as posted every Monday. Furthermore, they are screened for the lowest MaxDD% number meaning they have been showing better resistance to temporary sell offs than all others over the past year.
Here are the 10 candidates:
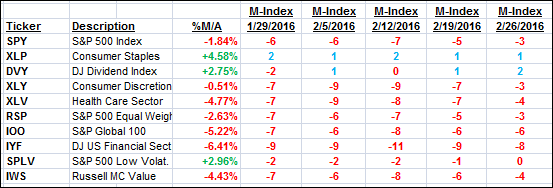
The above table simply demonstrates the magnitude with which some of the ETFs are fluctuating in regards to their positions above or below their respective individual trend lines (%M/A). A break below, represented by a negative number, shows weakness, while a break above, represented by a positive percentage, shows strength.
For hundreds of ETF/Mutual fund choices, be sure to reference Thursday’s StatSheet.
Year to date, here’s how the above candidates have fared so far:
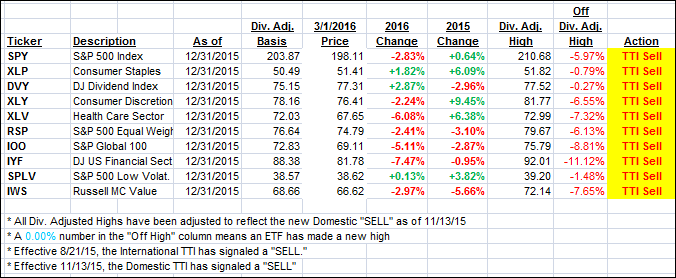
Again, the first table above shows the position of the various ETFs in relation to their respective long term trend lines (%M/A), while the second one tracks their trailing sell stops in the “Off High” column. The “Action” column will signal a “Sell” once the -7.5% point has been taken out in the “Off High” column.
3. Trend Tracking Indexes (TTIs)
Our Domestic Trend Tracking Index (TTI) improved as the bear market rally shifted into overdrive. We will need to see a clear piercing of the trend line to the upside before surrendering our bearish posture.
Here’s how we closed:
Domestic TTI: -0.76% (last close -1.54%)—Sell signal effective 11/13/2015
International TTI: -6.72% (last close -8.41%)—Sell signal effective 8/21/2015
Disclosure: I am obliged to inform you that I, as well as advisory clients of mine, own some of these listed ETFs. Furthermore, they do not represent a specific investment recommendation for you, they merely show which ETFs from the universe I track are falling within the guidelines specified.
Contact Ulli