
1. Moving the Markets
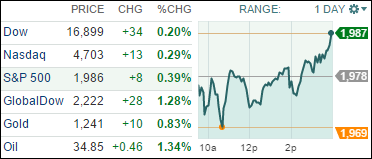
After posting its best start to March ever on signs the U.S. economy is perking up, U.S. stocks managed modest gains and the Nasdaq exited correction territory as investors digested the latest upward move and Super Tuesday results.
Tuesday’s rally, which was powered in part by incoming economic data that allegedly suggests that recession fears are overblown, was viewed through a positive lens by Wall Street.
Wall Street also woke up to a presidential campaign in which Democrat Hillary Clinton and Republican Donald Trump increased their leads against rivals after Super Tuesday voting in 11 states. Investors are closely watching the campaign as government-driven policies impact the performance of the economy and stock market.
We received an update on the economy today and the results were modest at best. The news was that the economy expanded in most regions over the past six weeks but activity slowed in some areas as the manufacturing industry continued to struggle, offsetting the recovering housing market and growth in consumer spending, the Federal Reserve said in their beige book report. In other words, it’s still questionable whether the next rate hike to be decided at the next Fed March meeting is still on.
2. ETFs in the Spotlight
In case you missed the announcement and description of this section, you can read it here again.
It features 10 broadly diversified ETFs from my HighVolume list as posted every Monday. Furthermore, they are screened for the lowest MaxDD% number meaning they have been showing better resistance to temporary sell offs than all others over the past year.
Here are the 10 candidates:
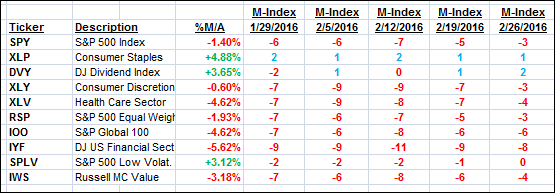
The above table simply demonstrates the magnitude with which some of the ETFs are fluctuating in regards to their positions above or below their respective individual trend lines (%M/A). A break below, represented by a negative number, shows weakness, while a break above, represented by a positive percentage, shows strength.
For hundreds of ETF/Mutual fund choices, be sure to reference Thursday’s StatSheet.
Year to date, here’s how the above candidates have fared so far:
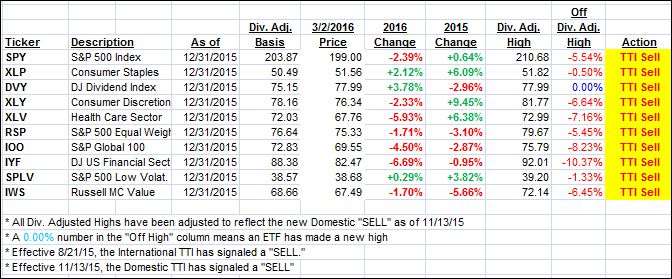
Again, the first table above shows the position of the various ETFs in relation to their respective long term trend lines (%M/A), while the second one tracks their trailing sell stops in the “Off High” column. The “Action” column will signal a “Sell” once the -7.5% point has been taken out in the “Off High” column.
3. Trend Tracking Indexes (TTIs)
Our Domestic Trend Tracking Index (TTI) changed only slightly as the current short squeeze rally took a breather.
Here’s how we ended up:
Domestic TTI: -0.74% (last close -0.76%)—Sell signal effective 11/13/2015
International TTI: -6.23% (last close -6.72%)—Sell signal effective 8/21/2015
Disclosure: I am obliged to inform you that I, as well as advisory clients of mine, own some of these listed ETFs. Furthermore, they do not represent a specific investment recommendation for you, they merely show which ETFs from the universe I track are falling within the guidelines specified.
Contact Ulli