
1. Moving the Markets
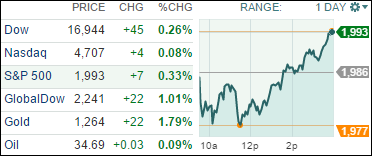
Sure, why not? Manufacturing is in a clear recession and the services economy is about to follow, but the short squeeze continued late in the day with the computer trading algos pushing the indexes another notch higher towards the 2,000 level on the S&P 500.
To my way of thinking, the markets are now so overbought during this 2 week straight up run based on absolutely no economic improvements since the S&P closed at the 1,829 level on February 11th. Reality has to set in sooner or later as this pace simply can’t be sustained given domestic and global data points. As I said before, bear market rallies can be downright stunning in their voraciousness as we just witnessed.
Investors also digested a spate of economic data today. The number of Americans filing for first-time jobless claims rose 6,000 to 278,000 in the past week, which is more than expected.
Wall Street will be closely eyeing the February jobs report set for release by the government tomorrow morning. Analysts forecast 200,000 new jobs created last month. The employment report is a key report, as it is closely watched by the Federal Reserve and how it comes in could impact the path of interest rates.
2. ETFs in the Spotlight
In case you missed the announcement and description of this section, you can read it here again.
It features 10 broadly diversified ETFs from my HighVolume list as posted every Monday. Furthermore, they are screened for the lowest MaxDD% number meaning they have been showing better resistance to temporary sell offs than all others over the past year.
Here are the 10 candidates:
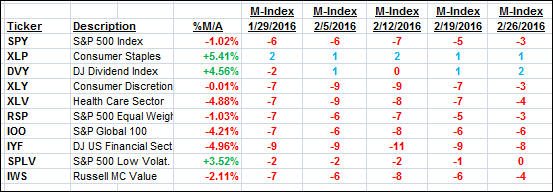
The above table simply demonstrates the magnitude with which some of the ETFs are fluctuating in regards to their positions above or below their respective individual trend lines (%M/A). A break below, represented by a negative number, shows weakness, while a break above, represented by a positive percentage, shows strength.
For hundreds of ETF/Mutual fund choices, be sure to reference Thursday’s StatSheet.
Year to date, here’s how the above candidates have fared so far:
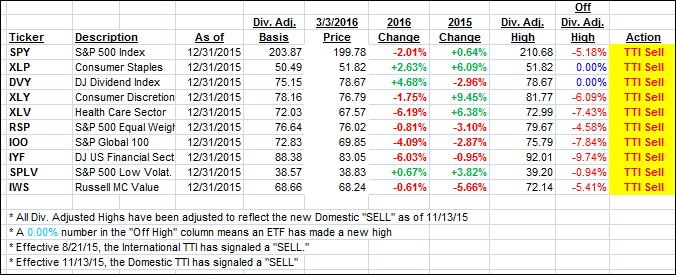
Again, the first table above shows the position of the various ETFs in relation to their respective long term trend lines (%M/A), while the second one tracks their trailing sell stops in the “Off High” column. The “Action” column will signal a “Sell” once the -7.5% point has been taken out in the “Off High” column.
3. Trend Tracking Indexes (TTIs)
Our Domestic Trend Tracking Index (TTI) moved closer to a potential trend line crossing but at this point remains on the bearish side.
Here’s how we closed:
Domestic TTI: -0.58% (last close -0.74%)—Sell signal effective 11/13/2015
International TTI: -5.44% (last close -6.23%)—Sell signal effective 8/21/2015
Disclosure: I am obliged to inform you that I, as well as advisory clients of mine, own some of these listed ETFs. Furthermore, they do not represent a specific investment recommendation for you, they merely show which ETFs from the universe I track are falling within the guidelines specified.
Contact Ulli