
1. Moving the Markets
Just when it looked like stocks would never go up again, the tide shifted slightly on Monday with the Dow edging higher by 52 points, relieving some of the bearish pressure that has weighed on Wall Street since the start of the year. Now, investors are eyeing a hoped-for bounce after plunging 6% last week and dipping to what Wall Street calls extremely “oversold levels.”
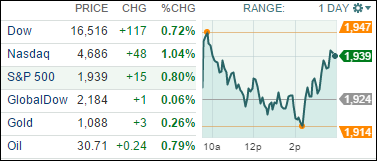
Equities staged another late day rally today, sending the Dow up 117 points, as Wall Street managed to post a second straight day of gains. But that’s not to say that investors didn’t see another volatile trading session. U.S. stocks initially posted big gains early following a day of market stability in China. That rally fizzled after a renewed dip in oil prices. But stocks reversed course again and moved higher late in the day.
Helping matters was a rise in the value of the Chinese currency, the yuan, for the third straight day. Prior to the recent streak of gains, the yuan (renminbi) had lost value vs. the USD for eight straight trading sessions, which suggested that China’s economy was worse off than previously believed.
There aren’t many people who feel bad for oil companies. But the implosion in oil prices, which briefly pushed the price of U.S. Crude below $30 a barrel Tuesday for the first time since 2003, is causing a profit decline that almost invokes pity. The companies in the S&P 500 energy sector are expected to lose a collective $28.8 billion this calendar year, down from $95.4 billion in net income earned during the industry’s bonanza year of 2008.
All of our 10 ETFs in the Spotlight participated in the rebound and closed up. Leading the field was Healthcare (XLV) with +1.28%, while the Select Dividend ETF (DVY) lagged with +0.10%.
2. ETFs in the Spotlight
In case you missed the announcement and description of this section, you can read it here again.
It features 10 broadly diversified ETFs from my HighVolume list as posted every Monday. Furthermore, they are screened for the lowest MaxDD% number meaning they have been showing better resistance to temporary sell offs than all others over the past year.
Here are the 10 candidates:
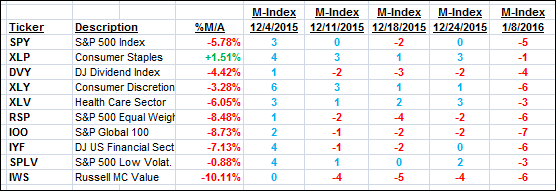
The above table simply demonstrates the magnitude with which some of the ETFs are fluctuating in regards to their positions above or below their respective individual trend lines (%M/A). A break below, represented by a negative number, shows weakness, while a break above, represented by a positive percentage, shows strength.
For hundreds of ETF/Mutual fund choices, be sure to reference Thursday’s StatSheet.
Year to date, here’s how the above candidates have fared so far:
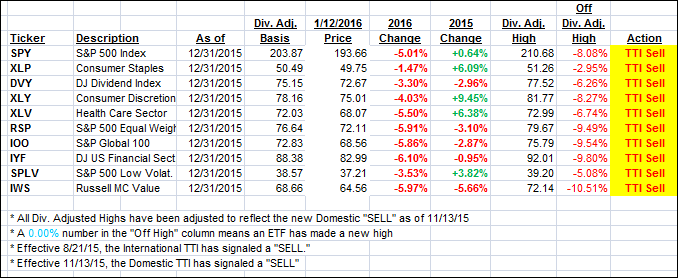
Again, the first table above shows the position of the various ETFs in relation to their respective long term trend lines (%M/A), while the second one tracks their trailing sell stops in the “Off High” column. The “Action” column will signal a “Sell” once the -7.5% point has been taken out in the “Off High” column.
3. Trend Tracking Indexes (TTIs)
Our Domestic Trend Tracking Index (TTI) improved as the major indexes showed some stability at the close for the second day in a row.
Here’s how we ended up:
Domestic TTI: -2.58% (last close -3.03%)—Sell signal effective 11/13/2015
International TTI: -9.49% (last close -9.85%)—Sell signal effective 8/21/2015
Disclosure: I am obliged to inform you that I, as well as advisory clients of mine, own some of these listed ETFs. Furthermore, they do not represent a specific investment recommendation for you, they merely show which ETFs from the universe I track are falling within the guidelines specified.
Contact Ulli