
1. Moving the Markets
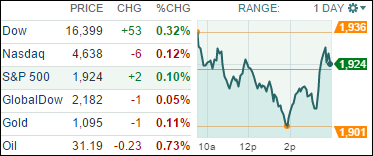
The stock market closed mixed on Monday, a welcome respite from what has been the worst start to a year ever on Wall Street, though the plunge in oil continued and sent crude prices to levels last seen in 2003. Stocks initially shrugged off more turbulence in the mainland China stock market overnight, where shares plunged 5.3% after last week’s 10% drubbing on growth fears, and jumped at the open only to see the gains evaporate at midday and then recover again late in the session.
Investors are still hoping the U.S. stock market can eventually stabilize after a horrific start to the year last week, when the Dow tumbled 6.2%, the Standard & Poor’s 500 fell 6% and the broad market, as measured by the Wilshire 5000 Total Market Index, suffered a paper loss of $1.5 trillion. To my way of thinking, the markets are simply adjusting to life without Fed intervention, which means that for the first time in years risk is being repriced based on underlying fundamentals—the way it should be.
The energy sector took the hardest hit as oil prices tumbled further and briefly fell below $31/barrel. U.S. crude slid 5.7% to $31.29 a barrel and is at the lowest level since 2003.
Wall Street will be watching the start of the fourth-quarter earnings reporting season, which unofficially kicks off after today’s closing bell with a report from aluminum maker Alcoa (AA). Like the past two quarters, analysts are projecting negative growth for the quarter.
7 of our 10 ETFs in the Spotlight finally managed to show a positive closed led by Consumer Staples (XLP) with +0.94%. On the downside, Healthcare (XLV) got clobbered at the tune of -1.19%.
We remain on the sidelines as the bear market continues. For the exact numbers, please see section 3 below.
2. ETFs in the Spotlight
In case you missed the announcement and description of this section, you can read it here again.
It features 10 broadly diversified ETFs from my HighVolume list as posted every Monday. Furthermore, they are screened for the lowest MaxDD% number meaning they have been showing better resistance to temporary sell offs than all others over the past year.
Here are the 10 candidates:
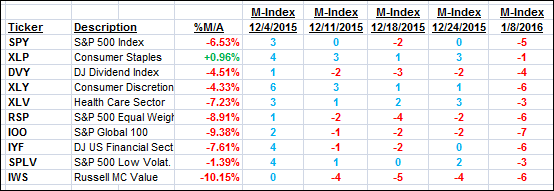
The above table simply demonstrates the magnitude with which some of the ETFs are fluctuating in regards to their positions above or below their respective individual trend lines (%M/A). A break below, represented by a negative number, shows weakness, while a break above, represented by a positive percentage, shows strength.
For hundreds of ETF/Mutual fund choices, be sure to reference Thursday’s StatSheet.
Year to date, here’s how the above candidates have fared so far:
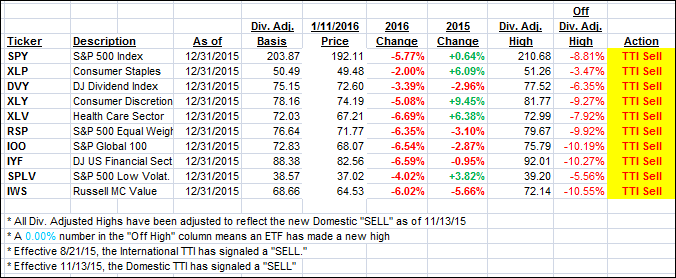
Again, the first table above shows the position of the various ETFs in relation to their respective long term trend lines (%M/A), while the second one tracks their trailing sell stops in the “Off High” column. The “Action” column will signal a “Sell” once the -7.5% point has been taken out in the “Off High” column.
3. Trend Tracking Indexes (TTIs)
Our Domestic Trend Tracking Index (TTI) slipped a tad and continued on its path deeper into bear market territory.
Here’s how we closed:
Domestic TTI: -3.03% (last close -2.96%)—Sell signal effective 11/13/2015
International TTI: -9.85% (last close -9.62%)—Sell signal effective 8/21/2015
Disclosure: I am obliged to inform you that I, as well as advisory clients of mine, own some of these listed ETFs. Furthermore, they do not represent a specific investment recommendation for you, they merely show which ETFs from the universe I track are falling within the guidelines specified.
Contact Ulli