
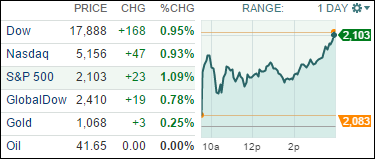
1. Moving the Markets
The all too familiar mantra pushed indexes higher with the S&P conquering the 2,100 level again. Equities rallied because economic outlook is fragile, bond yields are dropping, US manufacturing is extremely weak and suddenly the odds for a December rate hike are heading south. In other words, the markets rallied in the face of poor macro data. It almost seemed as if Wall Street expects another QE announcement by the Fed and not a rate hike. Go figure…
On the other hand, maybe markets just got into the Christmas spirit as all 3 major indexes gained about 1%. Historically, December has been a profitable month for stocks. In the past 100 years, December has ranked No. 1 in performance, posting an average gain of 1.46%, although gains have downsized to 1.37% in the past 20 years, according to Cap IQ.
Investors today seemed pleased with the results of Cyber Monday, which Adobe says is stacking up to be the “largest online sales day in history.” Adobe estimates that online sales yesterday totaled roughly $2.98 billion, a 12% increase over 2014 Cyber Monday sales.
The big event this December, of course, comes on Dec. 16, when the Federal Reserve breaks from its final meeting of the year and is expected to hike interest rates for the first time in nearly a decade. Wall Street is expecting short-term rates, currently pegged near 0%, to be increased by a quarter of a percentage point.
All of our 10 ETFs in the Spotlight followed the major indexes higher as Healthcare (XLV) took the lead by gaining +1.69%. Lagging the group was the Select Dividend ETF (DVY) with +0.74%.
2. ETFs in the Spotlight
In case you missed the announcement and description of this section, you can read it here again.
It features 10 broadly diversified ETFs from my HighVolume list as posted every Monday. Furthermore, they are screened for the lowest MaxDD% number meaning they have been showing better resistance to temporary sell offs than all others over the past year.
Here are the 10 candidates:
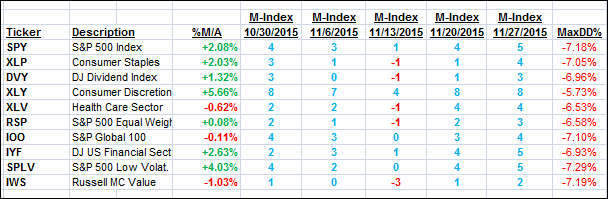
The above table simply demonstrates the magnitude with which some of the ETFs are fluctuating in regards to their positions above or below their respective individual trend lines (%M/A). A break below, represented by a negative number, shows weakness, while a break above, represented by a positive percentage, shows strength.
For hundreds of ETF/Mutual fund choices, be sure to reference Thursday’s StatSheet.
Year to date, here’s how the above candidates have fared so far:
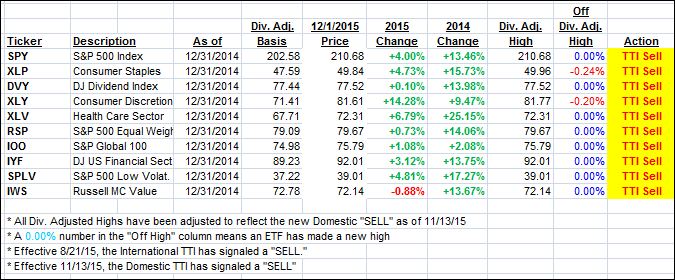
Again, the first table above shows the position of the various ETFs in relation to their respective long term trend lines (%M/A), while the second one tracks their trailing sell stops in the “Off High” column. The “Action” column will signal a “Sell” once the -7.5% point has been taken out in the “Off High” column.
3. Trend Tracking Indexes (TTIs)
Our Domestic Trend Tracking Index (TTI) showed some signs of life and headed higher. Let’s see if this level holds. In the meantime, some sectors ETFs are displaying nice upward momentum, and I’ll be looking for some limited exposure in that arena before pulling the trigger on a new domestic “Buy” signal.
Here’s how we closed:
Domestic TTI: +0.99% (last close +0.52%)—Sell signal effective 11/13/2015
International TTI: -2.24% (last close -3.00%)—Sell signal effective 8/21/2015
Disclosure: I am obliged to inform you that I, as well as advisory clients of mine, own some of these listed ETFs. Furthermore, they do not represent a specific investment recommendation for you, they merely show which ETFs from the universe I track are falling within the guidelines specified.
Contact Ulli