
1. Moving the Markets
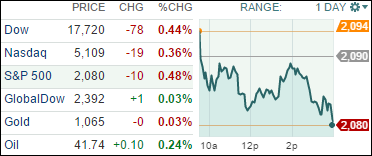
U.S. stocks traded modestly lower Monday as Wall Street kicked off a big week with investors eyeing Cyber Monday sales, a key bankers meeting in Europe Thursday that could result in more stimulus efforts and the monthly U.S. jobs report on Friday.
Heading into today’s trading session, which marks the final day of November, the broad S&P 500 stock index is up just 1.5% for the year and still down about 2% from its late May record close of 2130.82.
Black Friday and Cyber Monday sales will get their fair share of coverage this week, but so will a big batch of economic data, ranging from fresh readings on housing, manufacturing, vehicle sales, and factory orders. Perhaps the most anticipated piece of data will come on Friday, when we will hear the latest jobs report.
Many analysts are saying that if the U.S. economy, which generated a much-better-than-expected 271,000 jobs in October, can deliver another strong month of job gains, it will all but cement a Fed interest rate increase at the U.S. central bank’s last meeting of the year on Dec. 15-16.
All of our 10 ETFs in the Spotlight succumbed to today’s downward momentum and closed loser. Giving back the most was Healthcare (XLV) with -1.36%; holding up the best was the Mid-Cap Value (IWS) with -0.13%.
2. ETFs in the Spotlight
In case you missed the announcement and description of this section, you can read it here again.
It features 10 broadly diversified ETFs from my HighVolume list as posted every Monday. Furthermore, they are screened for the lowest MaxDD% number meaning they have been showing better resistance to temporary sell offs than all others over the past year.
Here are the 10 candidates:
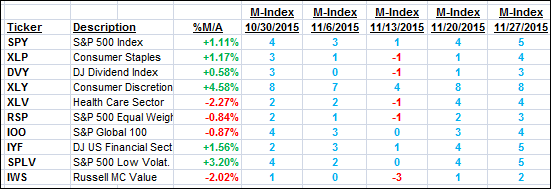
The above table simply demonstrates the magnitude with which some of the ETFs are fluctuating in regards to their positions above or below their respective individual trend lines (%M/A). A break below, represented by a negative number, shows weakness, while a break above, represented by a positive percentage, shows strength.
For hundreds of ETF/Mutual fund choices, be sure to reference Thursday’s StatSheet.
Year to date, here’s how the above candidates have fared so far:
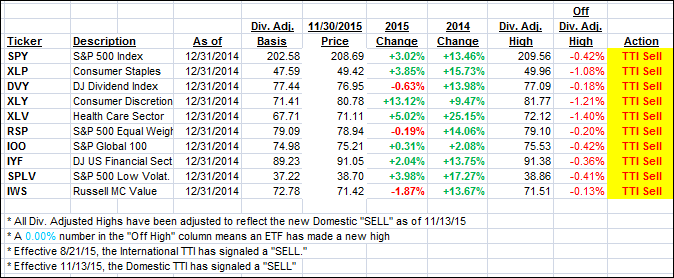
Again, the first table above shows the position of the various ETFs in relation to their respective long term trend lines (%M/A), while the second one tracks their trailing sell stops in the “Off High” column. The “Action” column will signal a “Sell” once the -7.5% point has been taken out in the “Off High” column.
3. Trend Tracking Indexes (TTIs)
Our Domestic Trend Tracking Index (TTI) retreated today and left us content with our current bearish posture. We’ll have to wait for more of a breakout to the upside before we can adopt a bullish position.
Here’s how we ended up:
Domestic TTI: +0.52% (last close +0.75%)—Sell signal effective 11/13/2015
International TTI: -3.00% (last close -2.89%)—Sell signal effective 8/21/2015
Disclosure: I am obliged to inform you that I, as well as advisory clients of mine, own some of these listed ETFs. Furthermore, they do not represent a specific investment recommendation for you, they merely show which ETFs from the universe I track are falling within the guidelines specified.
Contact Ulli