
1. Moving the Markets
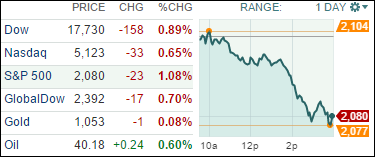
U.S. stocks were mixed most of the day, but then all three major benchmarks sank and finished down as news spread of a reported mass shooting in California. A standout amid the downturn was Yahoo (YHOO) as shares gained 5.8% on speculation the embattled tech icon may be acquired by an unspecified buyer.
In a midday Washington speech, Federal Reserve chair Yellen signaled that the Fed is all but certain to raise interest rates this month for the first time in nearly a decade, saying that gains in the economy and labor market have met the central bank’s goals.
Wall Street is still trying to discern if the health of the U.S. economy is vibrant enough to cope with rising rates, especially after yesterday’s reading on U.S. manufacturing in November, which contracted for the first time since the end of 2012. On the other side, in Europe, ECB chief Draghi is going the opposite direction by jawboning about another QE (Quantitative Easing) program for the region, which is surprising in that central banks usually coordinate and streamline their efforts.
Also, Wall Street also got the November reading on job creation in the private sector. The ADP report topped expectations, with private employers adding 217,000 jobs last month, which is above the 192,000 that had analysts had forecast.
Oil continues to stay at depressed prices. U.S. Crude Oil slid more than 4% to back to $40 a barrel, as inventories climbed.
In a reversal from yesterday’s session, all of our 10 ETFs in the Spotlight headed south as any follow through momentum to the upside was absent. Topping the list of losers was the Select Dividend ETF (DVY) with -1.54%. Resisting this sell-off the most were the Consumer Staples (XLP) with -0.50%.
2. ETFs in the Spotlight
In case you missed the announcement and description of this section, you can read it here again.
It features 10 broadly diversified ETFs from my HighVolume list as posted every Monday. Furthermore, they are screened for the lowest MaxDD% number meaning they have been showing better resistance to temporary sell offs than all others over the past year.
Here are the 10 candidates:
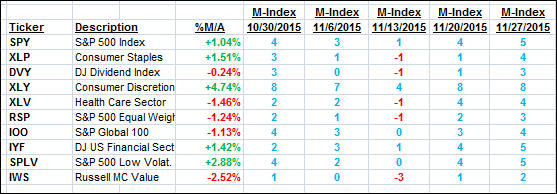
The above table simply demonstrates the magnitude with which some of the ETFs are fluctuating in regards to their positions above or below their respective individual trend lines (%M/A). A break below, represented by a negative number, shows weakness, while a break above, represented by a positive percentage, shows strength.
For hundreds of ETF/Mutual fund choices, be sure to reference Thursday’s StatSheet.
Year to date, here’s how the above candidates have fared so far:
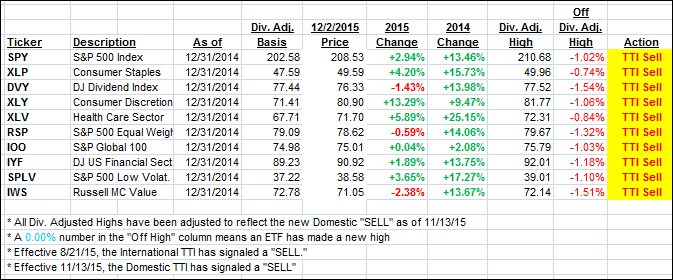
Again, the first table above shows the position of the various ETFs in relation to their respective long term trend lines (%M/A), while the second one tracks their trailing sell stops in the “Off High” column. The “Action” column will signal a “Sell” once the -7.5% point has been taken out in the “Off High” column.
3. Trend Tracking Indexes (TTIs)
Our Domestic Trend Tracking Index (TTI) dropped by the exact amount it gained the prior day leaving us still on the sidelines. However, as I mentioned yesterday, I started to look for some limited exposure in a couple of well performing sector funds. Remember, that sector and country funds run on their own cycles and are not necessarily tied into the Domestic TTI.
Here’s how we ended this down day:
Domestic TTI: +0.52% (last close +0.99%)—Sell signal effective 11/13/2015
International TTI: -3.03% (last close -2.24%)—Sell signal effective 8/21/2015
Disclosure: I am obliged to inform you that I, as well as advisory clients of mine, own some of these listed ETFs. Furthermore, they do not represent a specific investment recommendation for you, they merely show which ETFs from the universe I track are falling within the guidelines specified.
Contact Ulli