
1. Moving the Markets
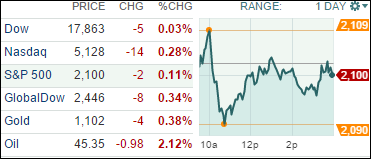
It was a see-saw kind of day with no clear direction, as tomorrow’s looming jobs report kept traders on edge. We saw small gains and small losses before settling slightly below the unchanged line.
On the horizon continues to be the “will they or will they not” scenario about a possible rise in interest rates in December. Voicing his view was Atlanta Fed President Lockhart, who chimed in by saying that the case for a rate hike will “continue to firm up.” His message did nothing to move the markets out of their 2-day consolidation phase.
The dollar rallied pushing down some commodities and crushing oil, which dropped from $48/barrel yesterday to $45 today. Even good earnings from Facebook and Ralph Lauren could not push the indexes into plus territory at the close.
3 of our 10 ETFs in the Spotlight bucked the trend and closed up led by the Financials (IYF) with +0.52%. On the losing side, Healthcare (XLV) took the dubious honors with a loss of -0.32%.
2. ETFs in the Spotlight
In case you missed the announcement and description of this section, you can read it here again.
It features 10 broadly diversified ETFs from my HighVolume list as posted every Monday. Furthermore, they are screened for the lowest MaxDD% number meaning they have been showing better resistance to temporary sell offs than all others over the past year.
Here are the 10 candidates:
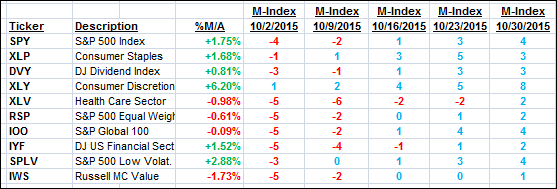
The above table simply demonstrates the magnitude with which some of the ETFs are fluctuating in regards to their positions above or below their respective individual trend lines (%M/A). A break below, represented by a negative number, shows weakness, while a break above, represented by a positive percentage, shows strength.
For hundreds of ETF/Mutual fund choices, be sure to reference Thursday’s StatSheet.
Year to date, here’s how the above candidates have fared so far:
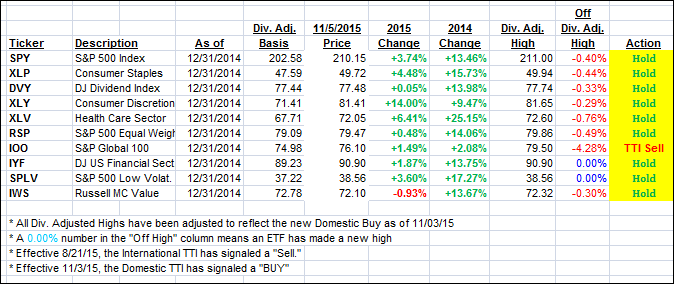
Again, the first table above shows the position of the various ETFs in relation to their respective long term trend lines (%M/A), while the second one tracks their trailing sell stops in the “Off High” column. The “Action” column will signal a “Sell” once the -7.5% point has been taken out in the “Off High” column.
3. Trend Tracking Indexes (TTIs)
Our Trend Tracking Indexes (TTIs) again changed very little, which did not affect our current positions.
Here’s how we ended up:
Domestic TTI: +0.57% (last Friday +0.63%)—Buy signal effective 11/3/2015
International TTI: -2.45% (last Friday -2.08%)—Sell signal effective 8/21/2015
A Sell signal will be generated once the Domestic TTI clearly breaks down below its trend line again.
Disclosure: I am obliged to inform you that I, as well as advisory clients of mine, own some of these listed ETFs. Furthermore, they do not represent a specific investment recommendation for you, they merely show which ETFs from the universe I track are falling within the guidelines specified.
Contact Ulli