
1. Moving the Markets
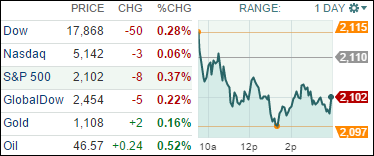
Stocks were trending upwards throughout the early part of the day, but fell after Fed Chair Janet Yellen said that a rate hike at its December meeting is a genuine possibility. The drop snapped a two day rally that pushed the Dow back into positive territory for the year. The Dow is still approaching its record 18,000 level, and many analysts see surpassing that high water mark as a legitimate possibility by year end.
In earnings action today, media giant Time Warner (TWX) topped earnings estimates with ease and also beat revenue expectations. On the other hand, shares of Papa John’s tumbled 14% after reporting slow third quarter sales and stating that they anticipate continued slower growth through the end of the year.
Also in the world of food giants, today Kraft Heinz (KHC) announced that it will close seven plants in north America over the next two years as part of a downsizing effort that will eliminate about 2,600 jobs.
Finally, it was not a great day for energy stocks. The S&P Energy (.SPNY) fell about 1% as U.S. crude oil dropped about 3% to close at $46.54 a barrel.
All of our 10 ETFs in the Spotlight followed the indexes lower. Consumer Discetionaries (XLY) fared the worst with -0.65%, while holding up best was the Dividend ETF (DVY) with -0.19%.
2. ETFs in the Spotlight
In case you missed the announcement and description of this section, you can read it here again.
It features 10 broadly diversified ETFs from my HighVolume list as posted every Monday. Furthermore, they are screened for the lowest MaxDD% number meaning they have been showing better resistance to temporary sell offs than all others over the past year.
Here are the 10 candidates:
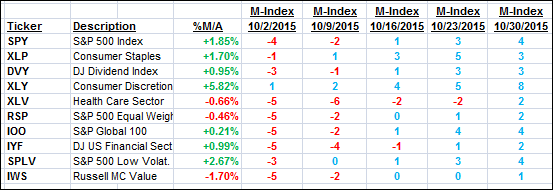
The above table simply demonstrates the magnitude with which some of the ETFs are fluctuating in regards to their positions above or below their respective individual trend lines (%M/A). A break below, represented by a negative number, shows weakness, while a break above, represented by a positive percentage, shows strength.
For hundreds of ETF/Mutual fund choices, be sure to reference Thursday’s StatSheet.
Year to date, here’s how the above candidates have fared so far:
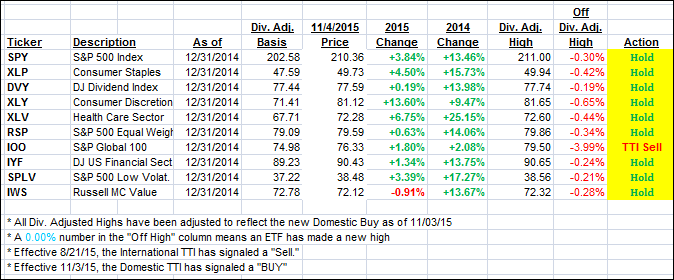
Again, the first table above shows the position of the various ETFs in relation to their respective long term trend lines (%M/A), while the second one tracks their trailing sell stops in the “Off High” column. The “Action” column will signal a “Sell” once the -7.5% point has been taken out in the “Off High” column.
3. Trend Tracking Indexes (TTIs)
Our Trend Tracking Indexes (TTIs) changed very little and did not affect our current positions.
Here’s how we closed:
Domestic TTI: +0.63% (last Friday +0.84%)—Buy signal effective 11/3/2015
International TTI: -2.08% (last Friday -1.97%)—Sell signal effective 8/21/2015
A Sell signal will be generated once the Domestic TTI clearly breaks down below its trend line again.
Disclosure: I am obliged to inform you that I, as well as advisory clients of mine, own some of these listed ETFs. Furthermore, they do not represent a specific investment recommendation for you, they merely show which ETFs from the universe I track are falling within the guidelines specified.
Contact Ulli