
1. Moving the Markets
A hazy batch of earnings reports were the culprit for the small losses on Wall Street today.
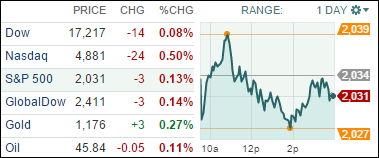
The Dow ended the day down a scant 14 points after bouncing in and out of negative territory. IBM (IBM), which is the Dow’s largest component, dragged the index down after weak hardware sales and the impact of the strong dollar hurt the company’s Q3 earnings.
The Dow would have slipped further if not for higher-than-expected earnings reports from three other Dow components – Verizon (VZ), United Technologies (UTX) and The Travelers Company (TRV).
Another stock on the move today was Yum Brands (YUM), which announced it is splitting the company in two, with one company focusing solely on its China business. Yum shares were up 3.8% to $74.48.
Other companies reporting later this week include Alphabet Inc. (GOOG), Amazon.com (AMZN) and Microsoft (MSFT).
5 of our 10 ETFs in the Spotlight gained while 5 of them lost. Sporting the best gain were the Financials (IYF) with +0.51% while the loser of the day was Healthcare (XLV) with -1.53%.
2. ETFs in the Spotlight
In case you missed the announcement and description of this section, you can read it here again.
It features 10 broadly diversified ETFs from my HighVolume list as posted every Monday. Furthermore, they are screened for the lowest MaxDD% number meaning they have been showing better resistance to temporary sell offs than all others over the past year.
Here are the 10 candidates:
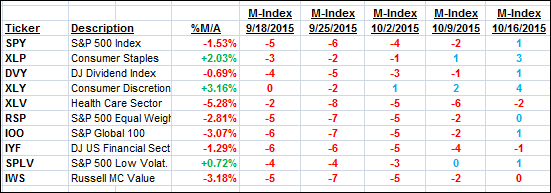
The above table simply demonstrates the magnitude with which some of the ETFs are fluctuating in regards to their positions above or below their respective individual trend lines (%M/A). A break below, represented by a negative number, shows weakness, while a break above, represented by a positive percentage, shows strength.
For hundreds of ETF/Mutual fund choices, be sure to reference Thursday’s StatSheet.
Year to date, here’s how the above candidates have fared so far:
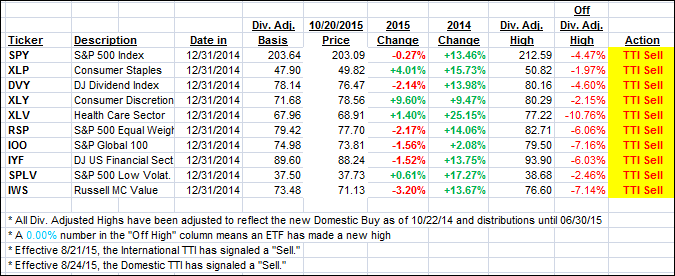
Again, the first table above shows the position of the various ETFs in relation to their respective long term trend lines (%M/A), while the second one tracks their trailing sell stops in the “Off High” column. The “Action” column will signal a “Sell” once the -7.5% point has been taken out in the “Off High” column.
3. Trend Tracking Indexes (TTIs)
Our Trend Tracking Indexes (TTIs) slipped at tad and remain in bear market territory for the time being.
Here’s how we ended up:
Domestic TTI: -0.49% (last close -0.27%)—Sell signal effective 8/24/2015
International TTI: -3.78% (last close -3.47%)—Sell signal effective 8/21/2015
Until the respective trend lines get clearly broken to the upside, we are staying on the sidelines.
Disclosure: I am obliged to inform you that I, as well as advisory clients of mine, own some of these listed ETFs. Furthermore, they do not represent a specific investment recommendation for you, they merely show which ETFs from the universe I track are falling within the guidelines specified.
Contact Ulli