
1. Moving the Markets
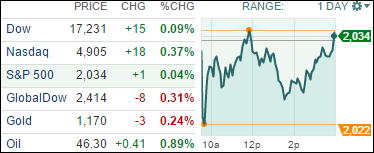
The Dow and S&P 500 just barely managed gains, as investors await a big week of earnings reports and reacted to data out of China showing GDP growth below 7%.
The good news…after suffering its first 10% correction this summer, the Dow has rebounded in recent weeks. The blue-chip index has finished up three straight weeks, its longest winning streak since late last year and the rally has helped the Dow trim its decline to being down just 3.4% for the year. Let’s see if this run can continue.
At least partly impacting stocks today was news out of China, where third-quarter GDP came in at 6.9%. While growth last quarter was better than the 6.8% growth rate analysts had forecast, it was still below the second-quarter’s 7% growth and raised questions as to whether China will be able to reach its full-year GDP target of +7%.
Traders are gearing up for a big week of earnings reports. More than 20% of S&P 500 companies and a dozen Dow stocks are set to report this week. So far this earnings season, 71% of the 58 companies in the S&P 500 that have reported results have topped sharply reduced forecasts.
6 of our 10 ETFs in the Spotlight managed to crawl above the unchanged line with Consumer Discretionaries (XLY) taking the lead with a gain of +0.47%. The S&P 500 Equal Weight ETF (RSP) trailed with -0.14%.
2. ETFs in the Spotlight
In case you missed the announcement and description of this section, you can read it here again.
It features 10 broadly diversified ETFs from my HighVolume list as posted every Monday. Furthermore, they are screened for the lowest MaxDD% number meaning they have been showing better resistance to temporary sell offs than all others over the past year.
Here are the 10 candidates:
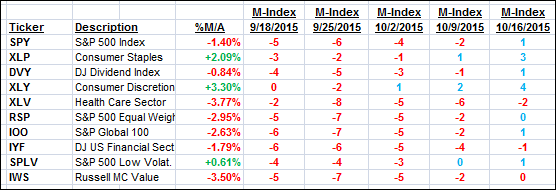
The above table simply demonstrates the magnitude with which some of the ETFs are fluctuating in regards to their positions above or below their respective individual trend lines (%M/A). A break below, represented by a negative number, shows weakness, while a break above, represented by a positive percentage, shows strength.
For hundreds of ETF/Mutual fund choices, be sure to reference Thursday’s StatSheet.
Year to date, here’s how the above candidates have fared so far:
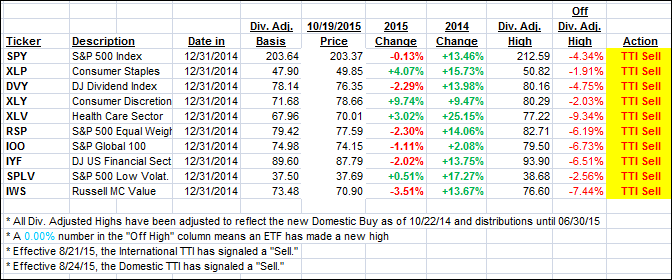
Again, the first table above shows the position of the various ETFs in relation to their respective long term trend lines (%M/A), while the second one tracks their trailing sell stops in the “Off High” column. The “Action” column will signal a “Sell” once the -7.5% point has been taken out in the “Off High” column.
3. Trend Tracking Indexes (TTIs)
Our Trend Tracking Indexes (TTIs) barely changed, and we will continue to wait and see if the rebound of the past few weeks ends up as a new Buy signal.
Here’s how we closed:
Domestic TTI: -0.27% (last close -0.31%)—Sell signal effective 8/24/2015
International TTI: -3.47% (last close -3.24%)—Sell signal effective 8/21/2015
Until the respective trend lines get clearly broken to the upside, we are staying on the sidelines.
Disclosure: I am obliged to inform you that I, as well as advisory clients of mine, own some of these listed ETFs. Furthermore, they do not represent a specific investment recommendation for you, they merely show which ETFs from the universe I track are falling within the guidelines specified.
Contact Ulli