
1. Moving the Markets
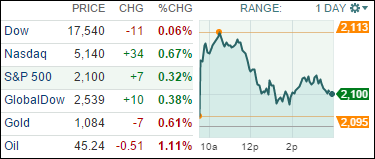
While most indexes managed to close above the unchanged line, the Dow ended up slipping thanks to a weak performance in energy and Disney.
The early rally was based on hope that odds of an interest rate increase by the Fed next month subsided a bit due to a soft reading on ADP’s payroll report of 185,000 newly created jobs in July vs. 229,000 in June.
Of course, as we’ve seen in the past, ADP being a front runner to Friday’s jobs report by the Labor Department does not mean there are any conclusions to be had in what Friday’s numbers will look like. In the past, we’ve seen higher and lower figures, so this is not indicative of what we can expect. Nevertheless, a weak report could mean that the Fed might not hike next month, or so the theory goes.
9 of our 10 ETFs in the Spotlight headed higher led by Healthcare (XLV) with +0.84%, as Consumer Discretionaries (XLY) bucked the trend and closed lower by -1.08%.
2. ETFs in the Spotlight
In case you missed the announcement and description of this section, you can read it here again.
It features 10 broadly diversified ETFs from my HighVolume list as posted every Monday. Furthermore, they are screened for the lowest MaxDD% number meaning they have been showing better resistance to temporary sell offs than all others over the past year.
Here are the 10 candidates:
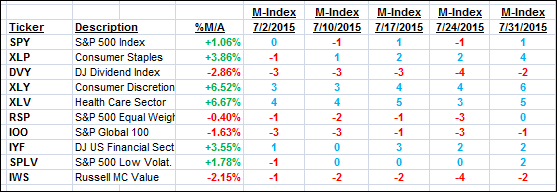
The above table simply demonstrates the magnitude with which some of the ETFs are fluctuating in regards to their positions above or below their respective individual trend lines (%M/A). A break below, represented by a negative number, shows weakness, while a break above, represented by a positive percentage, shows strength.
For hundreds of ETF/Mutual fund choices, be sure to reference Thursday’s StatSheet.
Year to date, here’s how the above candidates have fared so far:
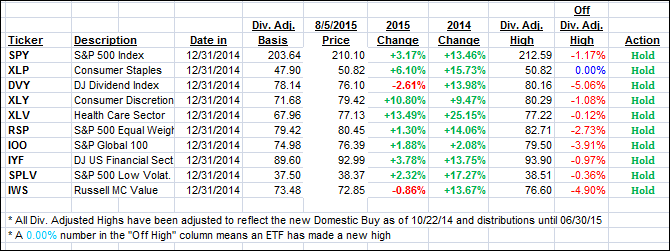
Again, the first table above shows the position of the various ETFs in relation to their respective long term trend lines (%M/A), while the second one tracks their trailing sell stops in the “Off High” column. The “Action” column will signal a “Sell” once the -7.5% point has been taken out in the “Off High” column.
3. Trend Tracking Indexes (TTIs)
Our Trend Tracking Indexes (TTIs) recouped yesterday’s losses and closed as follows:
Domestic TTI: +1.24% (last close +1.16%)—Buy signal effective 10/22/2014
International TTI: +1.32% (last close +0.97%)—Buy signal effective 2/13/2015
Disclosure: I am obliged to inform you that I, as well as advisory clients of mine, own some of these listed ETFs. Furthermore, they do not represent a specific investment recommendation for you, they merely show which ETFs from the universe I track are falling within the guidelines specified.
Contact Ulli