
1. Moving the Markets
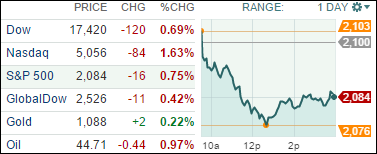
Stocks ended lower as the Dow shed 120 points, marking its sixth consecutive day of losses. The down-slide has come while Wall Street has been bracing for Friday’s employment report and the potential hints the jobs data might provide about the timing of an interest rate hike by the Fed.
Domestically, in the world of housing and real estate, mortgage rates are down from 3.98% to 3.91% while applications for jobless aid rose 3,000 to a seasonally adjusted 270,000. The four-week average, a less volatile measure, dropped 6,500 to 268,250. That average has fallen nearly 10% over the past year, close to levels last seen in 2000. Applications are a proxy for layoffs.
Moving to the world of social media, Twitter (TWTR) shares fell to a new all-time low on as Wall Street’s expectations for the struggling company continued to deflate. Twitter is plunging after executives predicted it would take “considerable” time for Twitter to figure out how to reignite stagnant user growth. The stock is now trading at around $27.50 a share, which is slightly above its IPO price of $26 a share. Stagnant growth in new subscribers has been the main focus of restructuring conversations over the past couple of months.
9 of our 10 ETFs in the Spotlight headed lower led by our leader YTD, Healthcare (XLV), with a -2.18% loss. Holding up very well was the loser YTD, the Select Dividend ETF (DVY), which managed to remain unchanged.
2. ETFs in the Spotlight
In case you missed the announcement and description of this section, you can read it here again.
It features 10 broadly diversified ETFs from my HighVolume list as posted every Monday. Furthermore, they are screened for the lowest MaxDD% number meaning they have been showing better resistance to temporary sell offs than all others over the past year.
Here are the 10 candidates:
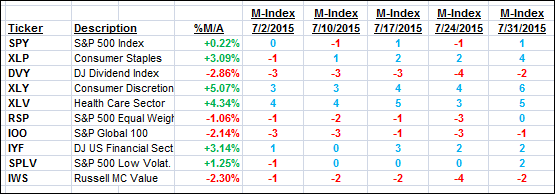
The above table simply demonstrates the magnitude with which some of the ETFs are fluctuating in regards to their positions above or below their respective individual trend lines (%M/A). A break below, represented by a negative number, shows weakness, while a break above, represented by a positive percentage, shows strength.
For hundreds of ETF/Mutual fund choices, be sure to reference Thursday’s StatSheet.
Year to date, here’s how the above candidates have fared so far:
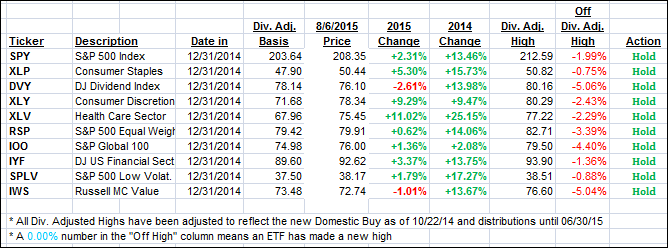
Again, the first table above shows the position of the various ETFs in relation to their respective long term trend lines (%M/A), while the second one tracks their trailing sell stops in the “Off High” column. The “Action” column will signal a “Sell” once the -7.5% point has been taken out in the “Off High” column.
3. Trend Tracking Indexes (TTIs)
Our Trend Tracking Indexes (TTIs) followed the roller coaster and closed down:
Domestic TTI: +0.73% (last close +1.24%)—Buy signal effective 10/22/2014
International TTI: +0.92% (last close +1.32%)—Buy signal effective 2/13/2015
Disclosure: I am obliged to inform you that I, as well as advisory clients of mine, own some of these listed ETFs. Furthermore, they do not represent a specific investment recommendation for you, they merely show which ETFs from the universe I track are falling within the guidelines specified.
Contact Ulli