
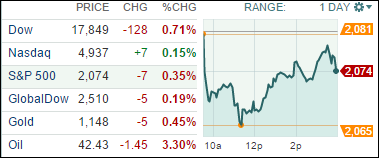
1. Moving the Markets
The Fed kicked off their two-day meeting today. Of course, the hot topic of late is whether or not they will raise interest rates in the near future. The general consensus around the news today is that the Fed is likely to announce that they will remain patient over the next couple of months through June.
It’s been a few days since I mentioned oil. The black gold has been teetering back and forth between $40-50 a barrel for the past couple of months, and there was no new major update today, apart from the fact that the price of U.S. benchmark crude dropped 1.6% to $43.18 a barrel and that the commodity has been on a 3-day losing streak ahead of official data that is supposed to be released within the next week.
For all you tech enthusiast, you will be pleased to here today that Adobe (ADBE) reported Q1 earnings that topped analysts’ expectations. The company said it had a first quarter earnings of $84.9 million. You may not, however, be pleased to hear that Microsoft (MSFT) has decided to scrap the beloved browser Internet Explorer. Apparently, Microsoft is putting its chips on its new and speedier browser named Project Spartan. We shall stay tuned to see what the new browser will entail.
All of our 10 ETFs in the Spotlight reversed direction from yesterday and slipped with Consumer Staples (XLP) leading to the downside with -0.72%, while Global 100 (IOO) managed to hold up the best at -0.17%.
2. ETFs in the Spotlight
In case you missed the announcement and description of this section, you can read it here again.
It features 10 broadly diversified ETFs from my HighVolume list as posted every Monday. Furthermore, they are screened for the lowest MaxDD% number meaning they have been showing better resistance to temporary sell offs than all others over the past year.
Here are the 10 candidates:
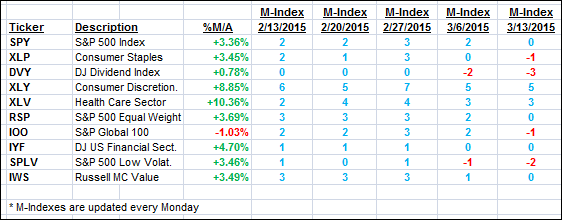
The above table simply demonstrates the magnitude with which some of the ETFs are fluctuating in regards to their positions above or below their respective individual trend lines (%M/A). A break below, represented by a negative number, shows weakness, while a break above, represented by a positive percentage, shows strength.
For hundreds of ETF/Mutual fund choices, be sure to reference Thursday’s StatSheet.
Year to date, here’s how the above candidates have fared so far:
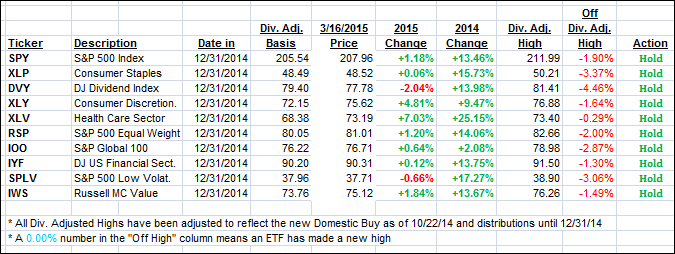
Again, the first table above shows the position of the various ETFs in relation to their respective long term trend lines (%M/A), while the second one tracks their trailing sell stops in the “Off High” column. The “Action” column will signal a “Sell” once the -7.5% point has been taken out in the “Off High” column.
3. Trend Tracking Indexes (TTIs)
Our Trend Tracking Indexes (TTIs) were mixed as the Domestic one inched up while the International one slipped a tad.
Here’s how we ended up:
Domestic TTI: +3.12% (last close +2.95%)—Buy signal effective 10/22/2014
International TTI: +2.90% (last close +3.14%)—Buy signal effective 2/13/2015
Disclosure: I am obliged to inform you that I, as well as advisory clients of mine, own some of these listed ETFs. Furthermore, they do not represent a specific investment recommendation for you, they merely show which ETFs from the universe I track are falling within the guidelines specified.
Contact Ulli