
1. Moving the Markets
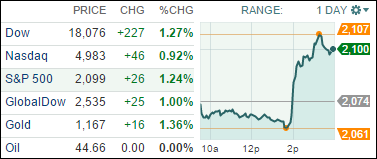
In a statement, the Fed, as expected, did drop its promise to be “patient” as it weighs interest rate hikes. Still, investors reacted bullishly to the suggestion that rate hikes were not baked in for June either, as feared, which potentially pushes out the first rate hike even later in the year. The Fed last hiked interest rates in 2006 mind you.
In commodities, Oil initially extended losses following the U.S. Energy Information Administration report that oil inventories rose by 9.6 million barrels. The much loved fossil fuel closed the day at $46.65 a barrel on the New York Mercantile Exchange.
In other news, Alibaba (BABA)’s share lock-up expires on Wednesday, allowing the Chinese e-commerce and web conglomerate to sell up to 437 million shares. And all you Microsoft (MSFT) junkies out there probably heard the announcement today that Windows 10 will hit the shelves of U.S. retailers this summer. It will be interesting to see the updates the company has incorporated and how it will impact the stock price moving forward.
All of our 10 ETFs in the Spotlight headed higher with solid gains. The Global 100 (IOO) was the leader with +1.71%, while the Financials (IYF) lagged with +0.65%. Healthcare (XLV) was the only one in the group to make new highs for the year as section 2 below shows.
2. ETFs in the Spotlight
In case you missed the announcement and description of this section, you can read it here again.
It features 10 broadly diversified ETFs from my HighVolume list as posted every Monday. Furthermore, they are screened for the lowest MaxDD% number meaning they have been showing better resistance to temporary sell offs than all others over the past year.
Here are the 10 candidates:
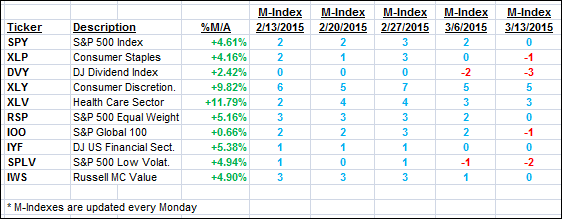
The above table simply demonstrates the magnitude with which some of the ETFs are fluctuating in regards to their positions above or below their respective individual trend lines (%M/A). A break below, represented by a negative number, shows weakness, while a break above, represented by a positive percentage, shows strength.
For hundreds of ETF/Mutual fund choices, be sure to reference Thursday’s StatSheet.
Year to date, here’s how the above candidates have fared so far:
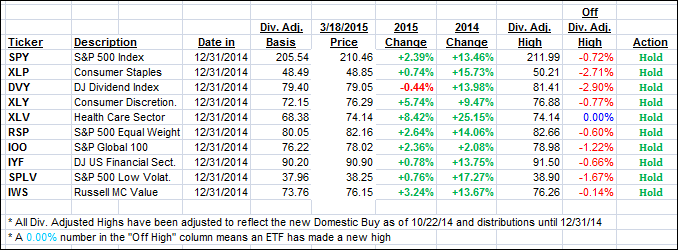
Again, the first table above shows the position of the various ETFs in relation to their respective long term trend lines (%M/A), while the second one tracks their trailing sell stops in the “Off High” column. The “Action” column will signal a “Sell” once the -7.5% point has been taken out in the “Off High” column.
3. Trend Tracking Indexes (TTIs)
Our Trend Tracking Indexes (TTIs) joined the party and closed deeper in bullish territory.
Here’s how we closed:
Domestic TTI: +3.93% (last close +3.12%)—Buy signal effective 10/22/2014
International TTI: +4.37% (last close +2.90%)—Buy signal effective 2/13/2015
Disclosure: I am obliged to inform you that I, as well as advisory clients of mine, own some of these listed ETFs. Furthermore, they do not represent a specific investment recommendation for you, they merely show which ETFs from the universe I track are falling within the guidelines specified.
Contact Ulli