
1. Moving the Markets
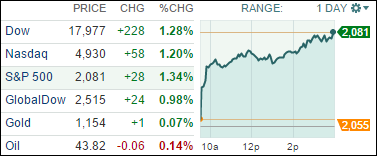
Markets soared higher today ahead of a two-day Federal Reserve meeting beginning tomorrow that may set the stage for the first U.S. interest rate hike since the global financial crisis.
In economic news, a growing number of investors expect the U.S. central bank to raise its benchmark interest rate sooner than anticipated and will be watching to see whether officials signal that’s the case. Many speculate that low interest rates have been boosting the stock market for the past couple of years and that a rise in interest rates could end the bull market in the near future but—no one really knows so we remain in rally mode leading up to the Fed announcement.
In the world of online advertising, Pinterest, a privately held company, has raised $367 million of late. The capital infusion has landed a valuation for the company around $11 billion, which makes the company one of the world’s most highly valued early stage companies. Prior to this funding round, Pinterest had raised $764 million.
All of our 10 ETFs in the Spotlight recovered and surged higher with healthcare (XLV) not only leading the pack with a +2.21% but also making new yearly highs. Mid-Caps (IWS) were lagging with “only” a +1.10% gain.
2. ETFs in the Spotlight
In case you missed the announcement and description of this section, you can read it here again.
It features 10 broadly diversified ETFs from my HighVolume list as posted every Monday. Furthermore, they are screened for the lowest MaxDD% number meaning they have been showing better resistance to temporary sell offs than all others over the past year.
Here are the 10 candidates:
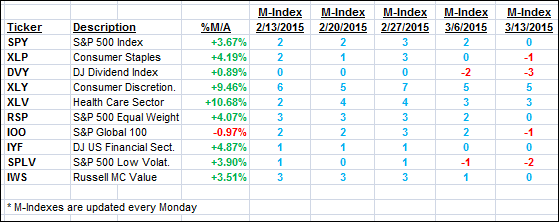
The above table simply demonstrates the magnitude with which some of the ETFs are fluctuating in regards to their positions above or below their respective individual trend lines (%M/A). A break below, represented by a negative number, shows weakness, while a break above, represented by a positive percentage, shows strength.
For hundreds of ETF/Mutual fund choices, be sure to reference Thursday’s StatSheet.
Year to date, here’s how the above candidates have fared so far:
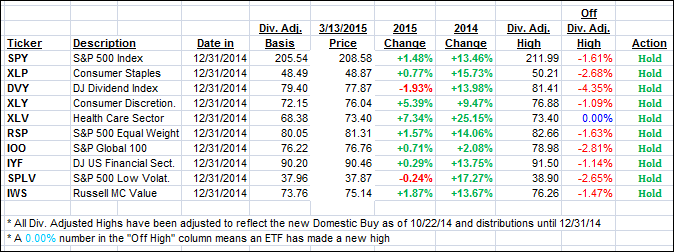
Again, the first table above shows the position of the various ETFs in relation to their respective long term trend lines (%M/A), while the second one tracks their trailing sell stops in the “Off High” column. The “Action” column will signal a “Sell” once the -7.5% point has been taken out in the “Off High” column.
3. Trend Tracking Indexes (TTIs)
Our Trend Tracking Indexes (TTIs) rallied nicely with the international one taking the lead, and we closed this bullish day as follows:
Domestic TTI: +2.95% (last close +2.47%)—Buy signal effective 10/22/2014
International TTI: +3.14% (last close +1.98%)—Buy signal effective 2/13/2015
Disclosure: I am obliged to inform you that I, as well as advisory clients of mine, own some of these listed ETFs. Furthermore, they do not represent a specific investment recommendation for you, they merely show which ETFs from the universe I track are falling within the guidelines specified.
Contact Ulli