
1. Moving the Markets
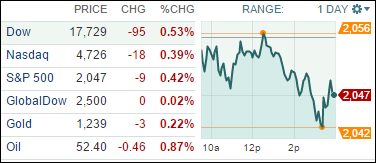
Concerns about the world economy dragged U.S. stocks lower on Monday with worries mounting over Greece’s standoff with its creditors. Greece’s defiant new government is waging a high-stakes poker game with its European lenders it seems. These games could go on forever though, as we all know.
According to Barclays, risk assets, including stocks in Europe and the U.S., are being weighed down following Greece’s insistence “not to seek an extension of its current bailout program.” The Greek drama is heating up as investors confront the prospect of a Greek default or an exit from the Eurozone. Still, global investors are hopeful a deal will be struck and the worst-case outcome avoided.
In oil news, retailers are preparing to report results from their most important quarter of the year, Q4. Retailers’ Q4 results are riding on high expectations that cheaper gas led consumers to splurge during the important holiday shopping season. Consumers already benefited last year from steady growth in jobs and low inflation, so let’s see how this year turns out.
On the positive side, in the toy world, Hasbro (HAS) jumped $3.92, or 7%, to $59.66 after the toy company turned in stronger quarterly results. Sales of toys geared toward boys surged, led by Transformers, Nerf and Marvel-brand action heroes. Hasbro also raised its dividend and expanded plans to buy back its own shares.
All our 10 ETFs in the Spotlight headed south as an initial rebound failed pushing the indexes lower. YTD, 5 of them are currently showing gains.
2. ETFs in the Spotlight
In case you missed the announcement and description of this section, you can read it here again.
It features 10 broadly diversified ETFs from my HighVolume list as posted every Monday. Furthermore, they are screened for the lowest MaxDD% number meaning they have been showing better resistance to temporary sell offs than all others over the past year.
Here are the 10 candidates:
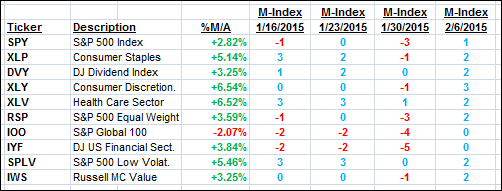
The above table simply demonstrates the magnitude with which some of the ETFs are fluctuating in regards to their positions above or below their respective individual trend lines (%M/A). A break below, represented by a negative number, shows weakness, while a break above, represented by a positive percentage, shows strength.
For hundreds of ETF/Mutual fund choices, be sure to reference Thursday’s StatSheet.
Year to date, here’s how the above candidates have fared so far:
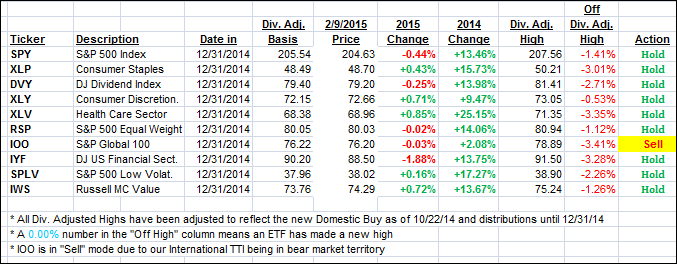
Again, the first table above shows the position of the various ETFs in relation to their respective long term trend lines (%M/A), while the second one tracks their trailing sell stops in the “Off High” column. The “Action” column will signal a “Sell” once the -7.5% point has been taken out in the “Off High” column.
3. Trend Tracking Indexes (TTIs)
Our Trend Tracking Indexes (TTIs) headed lower by a small margin with the International one showing the larger loss as it appears to be moving back towards its trend line. Because of the recent roller coaster ride, I will still hold off before declaring a new “Buy” signal in that arena.
Here’s how we ended this volatile day:
Domestic TTI: +2.54% (last close +2.77%)—Buy signal since 10/22/2014
International TTI: +0.46% (last close +0.89%)—Sell signal effective 12/15/14
Disclosure: I am obliged to inform you that I, as well as advisory clients of mine, own some of these listed ETFs. Furthermore, they do not represent a specific investment recommendation for you, they merely show which ETFs from the universe I track are falling within the guidelines specified.
Contact Ulli