
1. Moving the Markets
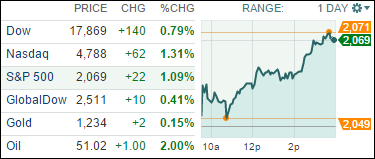
Stocks broke out of a two-day losing streak today as the S&P 500, Dow and Nasdaq all gained. The Dow got a boost today from a strong earnings report posted by Coca-Cola (KO). Coke topped earnings-per-share expectations by 2 cents on better-than-expected revenue of $10.87 billion. Shares of the stock jumped up close to 3%.
Of course, one of the biggest news stories was Apple (AAPL). Shares of the beloved tech company gained 1.9% to a price point of $122.02, which pushed the company’s net worth close to $710.7 billion. Once again, newspapers are raving about the fact that Apple is now the world’s first $700 billion company. Microsoft (MSFT) was the first company to close with a $600 billion valuation back in 2000. Apple has made a run at $700 billion before, but wasn’t ever able to close there until today.
It wasn’t all beautiful news for every sector today. Energy stocks fell as the price of benchmark U.S. crude dropped $2.84 to close at $50.02 a barrel on the New York Mercantile Exchange. The drop came after the International Energy Agency said that the rebound in prices of late will be “comparatively limited in scope.” Apparently, analysts at Citigroup agreed, saying that rising inventory costs could push the price of oil as low as $20 a barrel.
In an abrupt reversal from yesterday, all our 10 ETFs in the Spotlight joined the rally and closed higher with healthcare (XLV) leading the pack. One new high was made, and 9 of them are now on the plus side for the year.
2. ETFs in the Spotlight
In case you missed the announcement and description of this section, you can read it here again.
It features 10 broadly diversified ETFs from my HighVolume list as posted every Monday. Furthermore, they are screened for the lowest MaxDD% number meaning they have been showing better resistance to temporary sell offs than all others over the past year.
Here are the 10 candidates:
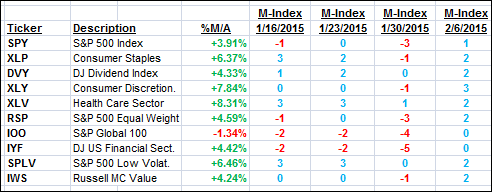
The above table simply demonstrates the magnitude with which some of the ETFs are fluctuating in regards to their positions above or below their respective individual trend lines (%M/A). A break below, represented by a negative number, shows weakness, while a break above, represented by a positive percentage, shows strength.
For hundreds of ETF/Mutual fund choices, be sure to reference Thursday’s StatSheet.
Year to date, here’s how the above candidates have fared so far:
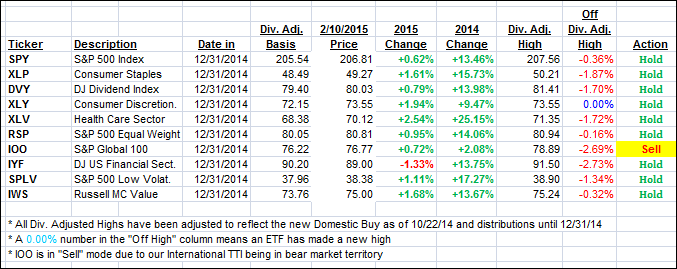
Again, the first table above shows the position of the various ETFs in relation to their respective long term trend lines (%M/A), while the second one tracks their trailing sell stops in the “Off High” column. The “Action” column will signal a “Sell” once the -7.5% point has been taken out in the “Off High” column.
3. Trend Tracking Indexes (TTIs)
Our Trend Tracking Indexes (TTIs) joined the roller coaster ride and improved their positions relative to their respective long-term trend lines. I am still on hold with the International TTI waiting for more upside confirmation before becoming outright bullish.
Here’s how we closed today:
Domestic TTI: +2.96% (last close +2.54%)—Buy signal since 10/22/2014
International TTI: +1.04% (last close +0.46%)—Sell signal effective 12/15/14
Disclosure: I am obliged to inform you that I, as well as advisory clients of mine, own some of these listed ETFs. Furthermore, they do not represent a specific investment recommendation for you, they merely show which ETFs from the universe I track are falling within the guidelines specified.
Contact Ulli