
1. Moving the Markets
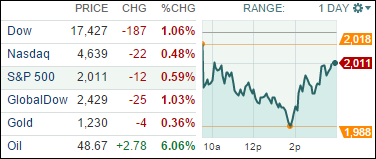
Markets dropped again today following a weak reading on holiday retail sales and a disappointing earnings report from JPMorgan (JPM). The consensus amongst analysts regarding the lower earnings is that the bank has been dragged down by ongoing legal costs.
Renewed turmoil in commodities also weighed on investors, as did a global growth downgrade from the World Bank for 2015. The World Bank now expects global growth of 3% this year vs. an initial estimate of 3.4%. The downgrade is due mainly to weakness in Europe, Japan and emerging markets
Crude oil rebounded a bit today. Both West Texas Intermediate and Brent Crude gained at least 4% and now stand around $48.50 a barrel.
Still, many earnings reports to come later this week. In the banking world, we’ll hear from Bank of America (BAC), Citigroup (C), Blackrock (BLK) and Goldman Sachs (GS). Stay tuned!
9 of our 10 ETFs in the Spotlight slipped as the roller coaster ride continued, 1 ETF closed up (DVY) and 3 ETFs managed to stay on the plus side YTD as section 2 below shows.
2. ETFs in the Spotlight
In case you missed the announcement and description of this section, you can read it here again.
It features 10 broadly diversified ETFs from my HighVolume list as posted every Monday. Furthermore, they are screened for the lowest MaxDD% number meaning they have been showing better resistance to temporary sell offs than all others over the past year.
Here are the 10 candidates:
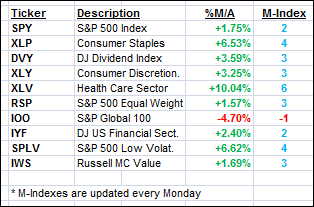
The above table simply demonstrates the magnitude with which some of the ETFs are fluctuating in regards to their positions above or below their respective individual trend lines (%M/A). A break below, represented by a negative number, shows weakness, while a break above, represented by a positive percentage, shows strength.
Year to date, here’s how the above candidates have fared so far:
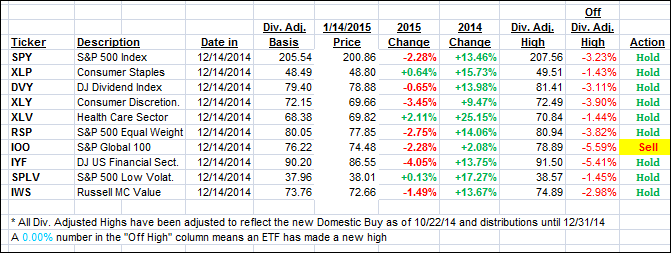
Again, the first table above shows the position of the various ETFs in relation to their respective long term trend lines (%M/A), while the second one tracks their trailing sell stops in the “Off High” column. The “Action” column will signal a “Sell” once the -7.5% point has been taken out in the “Off High” column.
3. Trend Tracking Indexes (TTIs)
Our Trend Tracking Indexes (TTIs) followed the general trend of the market and closed down ending the day as follows:
Domestic TTI: +2.16% (last close +2.28%)—Buy signal since 10/22/2014
International TTI: -2.44% (last close -2.06%)—New Sell signal effective 12/15/14
Disclosure: I am obliged to inform you that I, as well as advisory clients of mine, own some of these listed ETFs. Furthermore, they do not represent a specific investment recommendation for you, they merely show which ETFs from the universe I track are falling within the guidelines specified.
Contact Ulli