
1. Moving the Markets
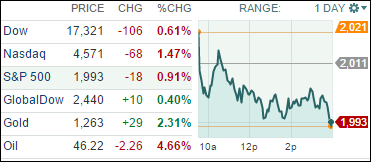
It was the Swiss National Bank (SNB) which stunned the markets by not only removing its currency peg with the Euro but also implementing a rate cut at the same time. Swiss stocks collapsed, rates crashed while the Swiss Franc soared leaving the big boys, who were short, wondering how to possibly cover their margin calls.
This was totally unexpected and created quite some turbulence as the major indexes, which were trending higher early in the morning, retreated for the rest of the session. Not helping matters were disappointing earnings results from some of the large banks and mixed economic news.
Oil prices joined the party and settled down some 4%. I am sure there will be more fallout from the Swiss surprise, but for right now domestic equities held up fairly well.
Again, 9 of our 10 ETFs in the Spotlight headed lower with one bucking the trend (XLP); 2 ETFs managed to stay on the plus side YTD as section 2 below shows.
2. ETFs in the Spotlight
In case you missed the announcement and description of this section, you can read it here again.
It features 10 broadly diversified ETFs from my HighVolume list as posted every Monday. Furthermore, they are screened for the lowest MaxDD% number meaning they have been showing better resistance to temporary sell offs than all others over the past year.
Here are the 10 candidates:

The above table simply demonstrates the magnitude with which some of the ETFs are fluctuating in regards to their positions above or below their respective individual trend lines (%M/A). A break below, represented by a negative number, shows weakness, while a break above, represented by a positive percentage, shows strength.
For more ETF/Mutual fund choices, be sure to reference Thursday’s StatSheet.
Year to date, here’s how the above candidates have fared so far:

Again, the first table above shows the position of the various ETFs in relation to their respective long term trend lines (%M/A), while the second one tracks their trailing sell stops in the “Off High” column. The “Action” column will signal a “Sell” once the -7.5% point has been taken out in the “Off High” column.
3. Trend Tracking Indexes (TTIs)
Our Trend Tracking Indexes (TTIs) were mixed with the Domestic one retreating while the International one was treading water.
Here’s how we closed:
Domestic TTI: +1.91% (last close +2.16%)—Buy signal since 10/22/2014
International TTI: -2.43% (last close -2.44%)—New Sell signal effective 12/15/14
Disclosure: I am obliged to inform you that I, as well as advisory clients of mine, own some of these listed ETFs. Furthermore, they do not represent a specific investment recommendation for you, they merely show which ETFs from the universe I track are falling within the guidelines specified.
Contact Ulli