

1. Moving the Markets
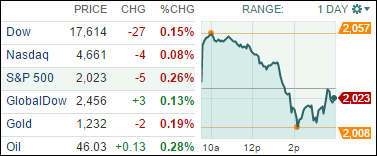
It was a wild and bumpy ride on Wall Street today. Volatility continued, and we saw the Dow swing back and forth to the tune of 400 points before closing in the red. Early gains were largely driven by upbeat investor sentiment reacting to Alcoa (AA) posting a top notch earnings report, Apple (AAPL) being upgraded, and as well receiving better-than-expected Chinese trade data. But once markets had climbed about 2% higher it seemed like investors took that as a signal to start selling and take profits.
Oil prices fell to just below $45 a barrel early in the day, however the slick fossil fuel was able to pare back losses by the close of trading. Oil now stands at $46.11 a barrel.
In other economic news, The World Bank trimmed its outlook for global growth today, saying a strengthening U.S. economy and plummeting oil prices won’t be enough to offset deepening trouble in the eurozone and emerging markets. Apparently, the World Bank said it expects the global economy to expand 3% this year, up from 2.6% in 2014, but still slower than its earlier 2015 forecast of 3.4%.
We still expect to hear earnings reports from major banks and Intel later on this week. So, stay tuned!
2 of our 10 ETFs in the Spotlight ended higher during this roller coaster ride; 3 ETFs are on the plus side YTD as the table below shows.
2. ETFs in the Spotlight
In case you missed the announcement and description of this section, you can read it here again.
It features 10 broadly diversified ETFs from my HighVolume list as posted every Monday. Furthermore, they are screened for the lowest MaxDD% number meaning they have been showing better resistance to temporary sell offs than all others over the past year.
Here are the 10 candidates:
The above table simply demonstrates the magnitude with which some of the ETFs are fluctuating in regards to their positions above or below their respective individual trend lines (%M/A). A break below, represented by a negative number, shows weakness, while a break above, represented by a positive percentage, shows strength.
Year to date, here’s how the above candidates have fared so far:
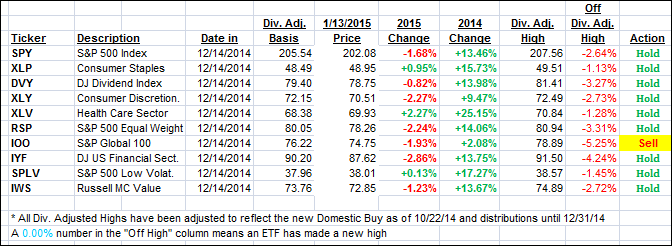
Again, the first table above shows the position of the various ETFs in relation to their respective long term trend lines (%M/A), while the second one tracks their trailing sell stops in the “Off High” column. The “Action” column will signal a “Sell” once the -7.5% point has been taken out in the “Off High” column.
3. Trend Tracking Indexes (TTIs)
Our Trend Tracking Indexes (TTIs) changed only slightly during this dead cat bounce session and closed as follows:
Domestic TTI: +2.28% (last close +2.18%)—Buy signal since 10/22/2014
International TTI: -2.06% (last close -2.38%)—New Sell signal effective 12/15/14
Disclosure: I am obliged to inform you that I, as well as advisory clients of mine, own some of these listed ETFs. Furthermore, they do not represent a specific investment recommendation for you, they merely show which ETFs from the universe I track are falling within the guidelines specified.
Contact Ulli