
1. Moving the Markets
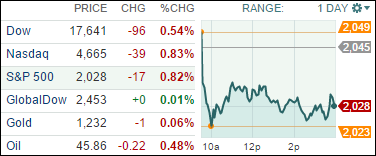
Volatility continues to be the name of the game thus far in 2015. Major indexes saw huge price swings, however, all of them closed the day in the red. The culprit impacting markets most seemed to once again be oil. Oil prices dropped another 5% today to close at $46.07 per barrel, its lowest level since April 2009.
Earnings season is picking up again. Alcoa (AA) is scheduled to post quarterly earnings after the closing bell, while financials JPMorgan Chase (JPM), Wells Fargo (WFC), Goldman Sachs (GS) and Citigroup (C) are amongst big banks due to report later in the week. Intel (INTC) is set to post earnings on Thursday as well.
There was some positive M&A news today. NPS Pharmaceuticals (NPSP) got a pop today (and was one of the most actives on the Nasdaq) after announcing that they had come to an agreement with Shire Plc to sell the company for $5.2 billion.
Let’s stay tuned to see if some positive earnings announcements can lift markets higher through the end of the week!
Only one of our 10 ETFs in the Spotlight managed to close up while the other ones retreated. Despite the sell-off this year, 3 ETFs have remained on the plus side YTD as the table below shows.
2. ETFs in the Spotlight
In case you missed the announcement and description of this section, you can read it here again.
It features 10 broadly diversified ETFs from my HighVolume list as posted every Monday. Furthermore, they are screened for the lowest MaxDD% number meaning they have been showing better resistance to temporary sell offs than all others over the past year.
Here are the 10 candidates:
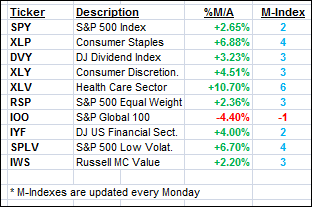
The above table simply demonstrates the magnitude with which some of the ETFs are fluctuating in regards to their positions above or below their respective individual trend lines (%M/A). A break below, represented by a negative number, shows weakness, while a break above, represented by a positive percentage, shows strength.
Year to date, here’s how the above candidates have fared so far:
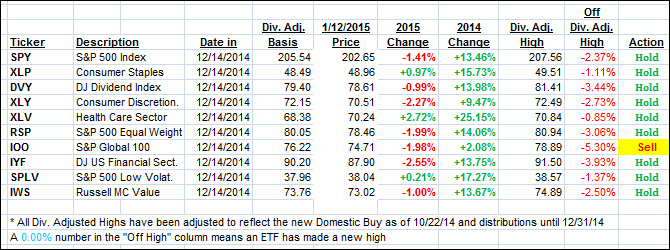
Again, the first table above shows the position of the various ETFs in relation to their respective long term trend lines (%M/A), while the second one tracks their trailing sell stops in the “Off High” column. The “Action” column will signal a “Sell” once the -7.5% point has been taken out in the “Off High” column.
3. Trend Tracking Indexes (TTIs)
Our Trend Tracking Indexes (TTIs) followed today’s downward momentum in the markets and closed as follows:
Domestic TTI: +2.18% (last close +2.43%)—Buy signal since 10/22/2014
International TTI: -2.38% (last close -2.19%)—New Sell signal effective 12/15/14
Disclosure: I am obliged to inform you that I, as well as advisory clients of mine, own some of these listed ETFs. Furthermore, they do not represent a specific investment recommendation for you, they merely show which ETFs from the universe I track are falling within the guidelines specified.
Contact Ulli