
1. Moving the Markets
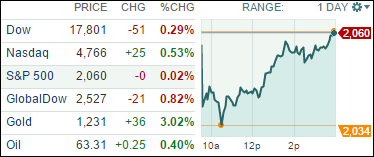
It was a bit of a quiet day in regards to market moving news. Stocks were steady early in the day, but fizzled later and, despite a tremendous rebound, the S&P 500 and Dow both closed in the red. The Nasdaq was the only major index that inched up, driven higher by strong tech stocks.
It was not a good day for Chinese equities. Hong Kong’s Hang Seng index tumbled 2.3% to 23,485.83 and mainland China’s Shanghai composite index plunged 5.4%. Also, half of the 15 stocks on the NYSE Arca China index, which trades on a major U.S. exchange, were down today. One of the big drivers impacting the Chinese markets negatively has been continued decline in energy stocks, as well as the fact that China tightened lending rules for short term loans.
Looking forward to the rest of December and onwards to 2015, it is fair to stay optimistic. An improving job market coupled with low oil prices means the outlook for 2015 is still looking good. But slower economic growth in the rest of the world and the uncertainty about interest rates could increase market volatility. As always, market pullbacks can occur at any time and for any reason, which means you better be prepared via my recommended exit strategy.
Again, 3 of our 10 ETFs in the Spotlight managed to climb higher today; however, none of them made new highs as the YTD table below shows.
2. ETFs in the Spotlight
In case you missed the announcement and description of this section, you can read it here again.
It features 10 broadly diversified ETFs from my HighVolume list as posted every Monday. Furthermore, they are screened for the lowest MaxDD% number meaning they have been showing better resistance to temporary sell offs than all others over the past year.
Here are the 10 candidates:
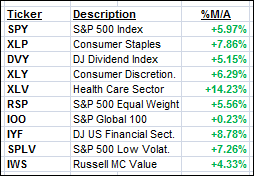
The above table simply demonstrates the magnitude with which some of the ETFs are fluctuating in regards to their positions above or below their respective individual trend lines (%M/A). A break below, represented by a negative number, shows weakness, while a break above, represented by a positive percentage, shows strength.
For additional ETF selections please review my weekly StatSheet, which is updated and posted every Thursday night.
Year to date, here’s how the above candidates have fared so far:
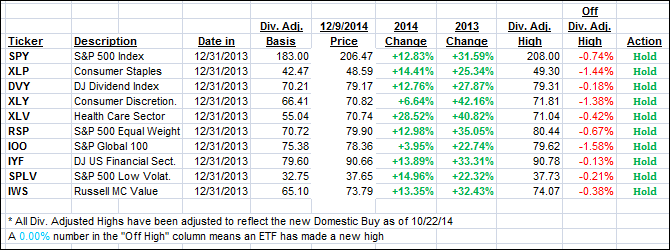
Again, the first table above shows the position of the various ETFs in relation to their respective long term trend lines (%M/A), while the second one tracks their trailing sell stops in the “Off High” column. The “Action” column will signal a “Sell” once the -7.5% point has been taken out in the “Off High” column.
3. Trend Tracking Indexes (TTIs)
Our Trend Tracking Indexes (TTIs) were mixed with the Domestic one gaining while the International one headed south.
Here’s how we closed:
Domestic TTI: +3.25% (last close +2.98%)—Buy signal since 10/22/2014
International TTI: +0.58% (last close +1.00%)—New Buy signal effective 11/24/14
Disclosure: I am obliged to inform you that I, as well as advisory clients of mine, own some of these listed ETFs. Furthermore, they do not represent a specific investment recommendation for you, they merely show which ETFs from the universe I track are falling within the guidelines specified.
Contact Ulli