
1. Moving the Markets
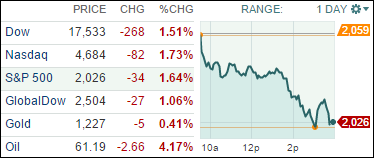
Stocks took a beating today. The S&P 500, Dow and Nasdaq all dropped more than 1.5%, and marked the third straight day of losses on Wall Street.
The dominant financial story remains oil, as the price of crude plunged again after the Organization of Petroleum Exporting Countries (OPEC) slashed its estimate of how much crude oil it will need to produce in 2015. Crude oil prices hit five-year lows today thanks to burgeoning supply from North American producers. The OPEC projection for 2015 production is 28.9 million barrels a day, which is 300,000 barrels more than previously forecast.
In addition to the dropping price of oil, the market has taken a hit on concerns over sluggish global economies, particularly in Asia and Europe. A sell-off of stocks in China continued today as well, despite a rebound today in Chinese equities that lifted the Shanghai composite index nearly 3%. While individual stocks may look good, the country is still experiencing slowing growth.
In positive glutinous news, Carl’s Jr., will become the first major fast-food chain to sell a “natural” burger when it rolls out the “All-Natural Burger” Dec. 17. The strategic move by the regional chain comes at a time when fast-food chains are fighting to improve the perceived quality of their food. But what exactly is “natural” about the burger? I guess we shall soon see.
All of our 10 ETFs in the Spotlight joined the trend reversal and headed south today as yesterday’s rebound from an early morning drop know looks like a dead cat bounce.
2. ETFs in the Spotlight
In case you missed the announcement and description of this section, you can read it here again.
It features 10 broadly diversified ETFs from my HighVolume list as posted every Monday. Furthermore, they are screened for the lowest MaxDD% number meaning they have been showing better resistance to temporary sell offs than all others over the past year.
Here are the 10 candidates:
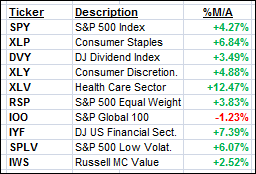
The above table simply demonstrates the magnitude with which some of the ETFs are fluctuating in regards to their positions above or below their respective individual trend lines (%M/A). A break below, represented by a negative number, shows weakness, while a break above, represented by a positive percentage, shows strength.
For additional ETF selections please review my weekly StatSheet, which is updated and posted every Thursday night.
Year to date, here’s how the above candidates have fared so far:
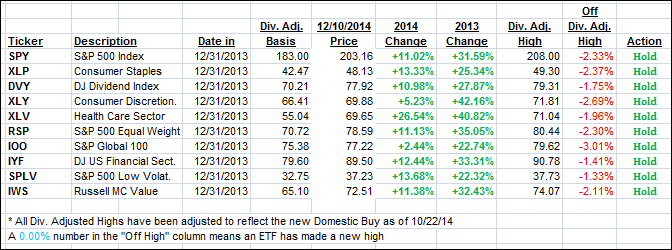
Again, the first table above shows the position of the various ETFs in relation to their respective long term trend lines (%M/A), while the second one tracks their trailing sell stops in the “Off High” column. The “Action” column will signal a “Sell” once the -7.5% point has been taken out in the “Off High” column.
3. Trend Tracking Indexes (TTIs)
Our Trend Tracking Indexes (TTIs) were mixed again. The Domestic one slipped a bit but remains on the bullish side of its trend line. The International one crossed its trend line to the downside into bearish territory. I will wait a few days for more downside confirmation before declaring this short Buy cycle to be over.
Here’s how we ended up:
Domestic TTI: +2.39% (last close +3.25%)—Buy signal since 10/22/2014
International TTI: -0.47% (last close +0.58%)—New Buy signal effective 11/24/14
Disclosure: I am obliged to inform you that I, as well as advisory clients of mine, own some of these listed ETFs. Furthermore, they do not represent a specific investment recommendation for you, they merely show which ETFs from the universe I track are falling within the guidelines specified.
Contact Ulli