
1. Moving the Markets
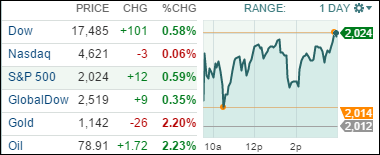
Stocks bounced back into record territory today after the GOP (Republican Party) regained control of the U.S. Senate for the first time in eight years. The S&P 500 gained 0.6% to close at an all-time high of 2,023.57. The Dow also gained 0.6% and closed at a record high of 17,484.53. The Nasdaq, however, dipped 0.1%.
The gridlock between republicans and democrats that will persist in the near future is expected to bode well for Wall St. According to Sam Stovall, U.S. equity strategist at S&P Capital IQ, “the combination of a Democratic president with a republican congress has been accompanied by the best average performance for the S&P 500 since 1945.”
Oil prices changed direction today, halting their recent slide and rising for the first time in a week. Prices rose $1.50 to $78.74 per barrel.
In earnings news, both Whole Foods (WFM) and Tesla (TSLA) posted earnings that topped Wall Street estimates today. Whole Foods said that sales rose 3.1% for Q3 and Tesla said its adjusted gain for Q3 amounted to $3 million of revenue.
We also heard from Time Warner Inc (TWX) today that its Q3 income fell by 18%, but that the company raised their earnings forecast for the full year, which prompted investors to drive the stock higher today. With pay-TV companies paying higher fees to carry its channels and more subscribers ordering HBO, its total revenues for the quarter climbed 3.3% to $6.2 billion.
9 of our 10 ETFs in the Spotlight gained today with 7 of them making new highs for the year.
2. ETFs in the Spotlight
In case you missed the announcement and description of this section, you can read it here again.
It features 10 broadly diversified ETFs from my HighVolume list as posted every Monday. Furthermore, they are screened for the lowest MaxDD% number meaning they have been showing better resistance to temporary sell offs than all others over the past year.
Here are the 10 candidates:
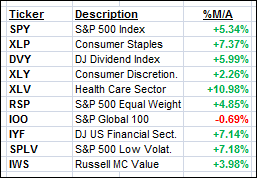
The above table simply demonstrates the magnitude with which some of the ETFs are fluctuating in regards to their positions above or below their respective individual trend lines (%M/A). A break below, represented by a negative number, shows weakness, while a break above, represented by a positive percentage, shows strength.
Year to date, here’s how the above candidates have fared so far:
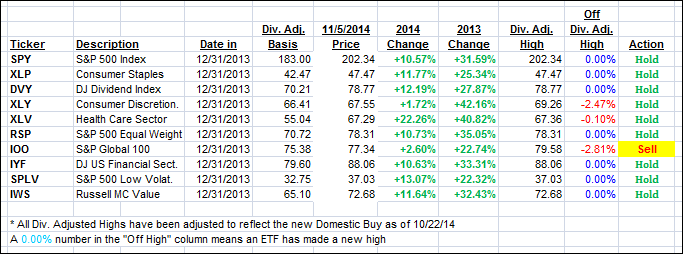
Again, the first table above shows the position of the various ETFs in relation to their respective long term trend lines (%M/A), while the second one tracks their trailing sell stops in the “Off High” column. The “Action” column will signal a “Sell” once the -7.5% point has been taken out in the “Off High” column.
3. Trend Tracking Indexes (TTIs)
Our Trend Tracking Indexes (TTIs) both improved with International one moving closer to its long-term trend line.
Here’s how we closed:
Domestic TTI: +2.85% (last close +2.61%)—Buy signal since 10/22/2014
International TTI: -0.63% (last close -1.02%)—Sell signal since 10/1/2014
Disclosure: I am obliged to inform you that I, as well as advisory clients of mine, own some of these listed ETFs. Furthermore, they do not represent a specific investment recommendation for you, they merely show which ETFs from the universe I track are falling within the guidelines specified.
Contact Ulli