
1. Moving the Markets
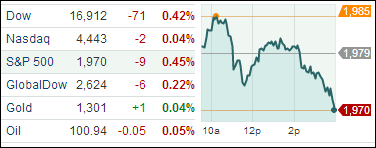
Stocks trended lower throughout the morning, but losses accelerated late in the day and the major indexes closed lower. Investors seemed to be torn between a batch of mostly positive earnings reports and rising global tensions. The S&P 500 ended below its 14-day moving average for a second straight day, and 9 of the 10 primary S&P 500 sectors fell on the day.
Although markets have dropped over the past two days, lackluster corporate earnings cannot be blamed. Almost 70% of companies reporting have topped earnings expectations, which is well above the 63% average.
The main culprit for foul market sentiment today seemed to be the Ukraine/Russia turmoil. President Barack Obama said the U.S. was imposing new sanctions on Russia in the energy, arms and finance sectors, as a reaction to Moscow’s support for rebels in eastern Ukraine.
Alongside the international conflicts, investors seem to be awaiting the GDP numbers that the Fed will release tomorrow. If the numbers come in favorably, then perhaps we may see some better index performance to close out the day.
In a reversal from yesterday, 9 of our 10 ETFs in the Spotlight slipped today while 1 gained. No new highs were made.
2. ETFs in the Spotlight
In case you missed the announcement and description of this section, you can read it here again.
It features 10 broadly diversified ETFs from my HighVolume list as posted every Monday. Furthermore, they are screened for the lowest MaxDD% number meaning they have been showing better resistance to temporary sell offs than all others over the past year.
Here are the 10 candidates:
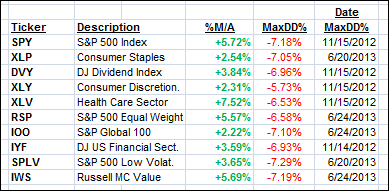
All of them are in “buy” mode, meaning their prices are above their respective long term trend lines by the percentage indicated (%M/A).
Year to date, here’s how the above candidates have fared so far:
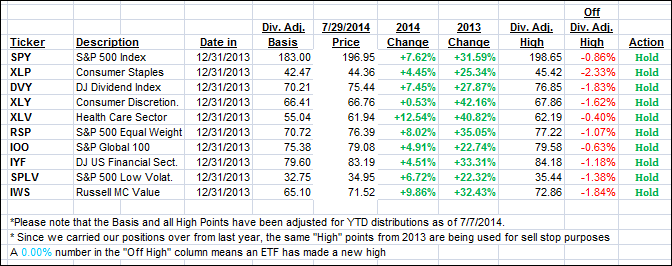
To be clear, the first table above shows the position of the various ETFs in relation to their respective long term trend lines (%M/A), while the second one tracks their trailing sell stops in the “Off High” column. The “Action” column will signal a “Sell” once the -7.5% point is taken out in the “Off High” column.
3. Domestic Trend Tracking Indexes (TTIs)
Our Trend Tracking Indexes (TTIs) changed only fractionally:
Domestic TTI: +2.48% (last close +2.60%)
International TTI: +2.89% (last close +2.87%)
Disclosure: I am obliged to inform you that I, as well as advisory clients of mine, own some of these listed ETFs. Furthermore, they do not represent a specific investment recommendation for you, they merely show which ETFs from the universe I track are falling within the guidelines specified.
Contact Ulli