
1. Moving The Markets
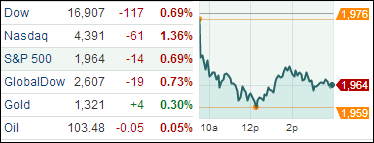
It was a good day for German soccer fans, but the same joys were not felt by U.S. investors. Stocks tumbled as the Dow fell nearly 118 points, ending the trading day below the glorious 17,000 mark it surpassed for the first time recently. The S&P 500 and the Nasdaq retreated as well, as the chart above shows.
The buzz on market sentiment today again centered on the upcoming Q2 earnings season. According to Thomson Reuters, the number of companies expecting profit shortfalls outnumbers those predicting upside earnings surprises by a 4 to 1 ratio, which is above the long-term average of 2.6. Thus, investors remain bearish on upcoming earnings announcements.
Weakness in tech shares pressured the Nasdaq today, with Internet names especially hit hard. Netflix Inc (NFLX) fell 3.4% to $445.05 while Facebook Inc (FB) dropped 3.9% to $62.76. Also, TripAdvisor Inc (TRIP) sank 5.5% to $101.45.
Asian stock markets were mostly lower as Japan’s Nikkei 225 index slipped 0.4% and Hong Kong’s Hang Seng index was basically flat.
Our 10 ETFs in the Spotlight slipped a bit but one of them actually managed to eked out a gain on this bearish day.
2. ETFs in the Spotlight
In case you missed the announcement and description of this section, you can read it here again.
It features 10 broadly diversified ETFs from my HighVolume list as posted every Monday. Furthermore, they are screened for the lowest MaxDD% number meaning they have been showing better resistance to temporary sell offs than all others over the past year.
In other words, none of them ever triggered their 7.5% sell stop level during this time period, which included a variety of severe market pullbacks but no move into outright bear market territory.
Here are the 10 candidates:
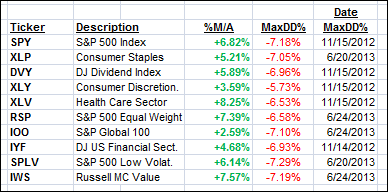
All of them are in “buy” mode, meaning their prices are above their respective long term trend lines by the percentage indicated (%M/A).
Year to date, here’s how the above candidates have fared so far:
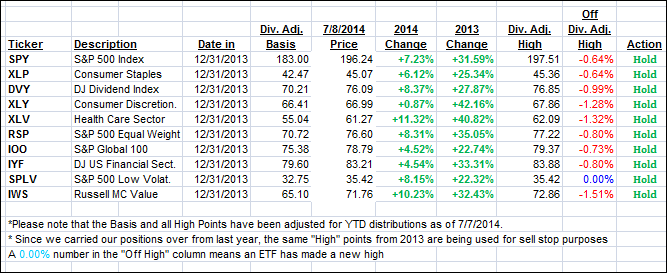
To be clear, the first table above shows the position of the various ETFs in relation to their respective long term trend lines (%M/A), while the second one tracks their trailing sell stops in the “Off High” column. The “Action” column will signal a “Sell” once the -7.5% point is taken out in the “Off High” column.
3. Domestic Trend Tracking Indexes (TTIs)
Our Trend Tracking Indexes (TTIs) pulled back with the International TTI suffering the brunt of the selling:
Domestic TTI: +3.11% (last close +3.90%)
International TTI: +3.33% (last close +4.58%)
Disclosure: I am obliged to inform you that I, as well as advisory clients of mine, own some of these listed ETFs. Furthermore, they do not represent a specific investment recommendation for you, they merely show which ETFs from the universe I track are falling within the guidelines specified.
Contact Ulli