
1. Moving The Markets
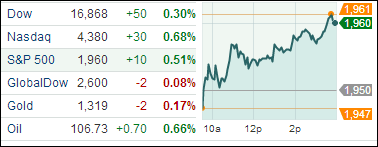
Stocks snapped a two-day losing streak despite the anticipated news that the economy shrank 2.9% in the first quarter. The S&P 500 gained 0.5%, the Dow rose 0.3% and the Nasdaq posted the largest gain of 0.68%.
The general sentiment about the lackluster first quarter mostly relates to the ‘arctic’ winter that blasted the mid and eastern part of the U.S. So, this leaves many optimistic that the economy should keep trucking ahead on an upward climb given the positive economic data on manufacturing, hiring and auto sales for the past two months.
Barnes & Noble (BKS), the struggling bookseller, saw its shares jump up 8% Wednesday after reporting that it will spin off its Nook digital book business. The Nook business will be spun off into a new publicly traded company called Nook Media, is 17% owned by Microsoft (MSFT) and 5% owned by publisher Pearson (PSO).
We also saw shares of CBS (CBS) gain 6.19% today after the Supreme Court ruled that Aereo’s streaming TV service is a violation of Copyright laws. Disney (DIS), Time Warner (TWC), and Comcast (CMCSA) stocks were all up after the ruling came down.
Our 10 ETFs in the Spotlight joined the rebound and gained with only our leading ETF for the year making a new high today…
2. ETFs in the Spotlight
In case you missed the announcement and description of this section, you can read it here again.
It features 10 broadly diversified ETFs from my HighVolume list as posted every Monday. Furthermore, they are screened for the lowest MaxDD% number meaning they have been showing better resistance to temporary sell offs than all others over the past year.
In other words, none of them ever triggered their 7.5% sell stop level during this time period, which included a variety of severe market pullbacks but no move into outright bear market territory.
Here are the 10 candidates:
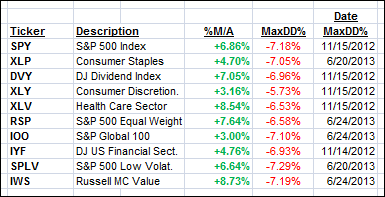
All of them are in “buy” mode, meaning their prices are above their respective long term trend lines by the percentage indicated (%M/A).
Year to date, here’s how the above candidates have fared so far:
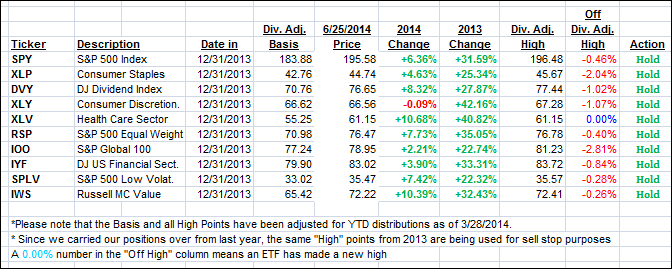
To be clear, the first table above shows the position of the various ETFs in relation to their respective long term trend lines (%M/A), while the second one tracks their trailing sell stops in the “Off High” column. The “Action” column will signal a “Sell” once the -7.5% point is taken out in the “Off High” column.
3. Domestic Trend Tracking Indexes (TTIs)
Our Trend Tracking Indexes (TTIs) recovered and headed back north closing as follows:
Domestic TTI: +3.61% (last close +3.29%)
International TTI: +3.95% (last close +3.90%)
Disclosure: I am obliged to inform you that I, as well as advisory clients of mine, own some of these listed ETFs. Furthermore, they do not represent a specific investment recommendation for you, they merely show which ETFs from the universe I track are falling within the guidelines specified.
Contact Ulli
Comments 2
Do your performance figures for ETF’s in the spotlight assume reinvestment of cash dividends? Either way, how do you adjust performance figures to accurately reflect the gain?
David,
For simplicity sake, I use dividend adjusted prices for the basis as the YTD table shows. Therefore, dividends are not reinvested, and the performance shown represents the change in prices only for the period shown.
Ulli…