
1. Moving The Markets
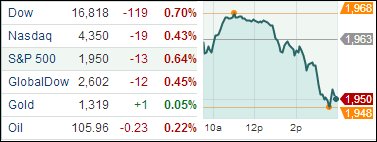
U.S. indexes fell across the board on Tuesday (see above chart), largely due to drops in blue-chip stocks such as Exxon Mobil (XOM), Verizon (VZ) and American Express (AMEX), which all fell more than 1% on the day.
One of the biggest market movers today was Vertex Pharmaceuticals (VFTX). The stock gained a massive $26.92 or 40.41% after the company announced that its treatment for cystic fibrosis (a pill called Lumacaftor) met the primary goals of the late-stage trial. Goldman Sachs estimates the drug could tally sales above $5bn a year at its peak. The news lifted the broader sector as well. The Nasdaq Biotech index climbed 1 per cent.
Many investors await an update from the government on the state of the economy coming up tomorrow. Although new home sales last month blew past forecasts to their strongest pace in six years, the prospect that the government may announce that the economy shrank in the first quarter even more than the negative 1% figure given out last month still has many full of anxiety.
Our 10 ETFs in the Spotlight pulled back as well; no new highs were made and 9 of them reside on the plus side YTD.
2. ETFs in the Spotlight
In case you missed the announcement and description of this section, you can read it here again.
It features 10 broadly diversified ETFs from my HighVolume list as posted every Monday. Furthermore, they are screened for the lowest MaxDD% number meaning they have been showing better resistance to temporary sell offs than all others over the past year.
In other words, none of them ever triggered their 7.5% sell stop level during this time period, which included a variety of severe market pullbacks but no move into outright bear market territory.
Here are the 10 candidates:
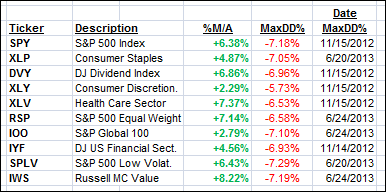
All of them are in “buy” mode, meaning their prices are above their respective long term trend lines by the percentage indicated (%M/A).
Year to date, here’s how the above candidates have fared so far:
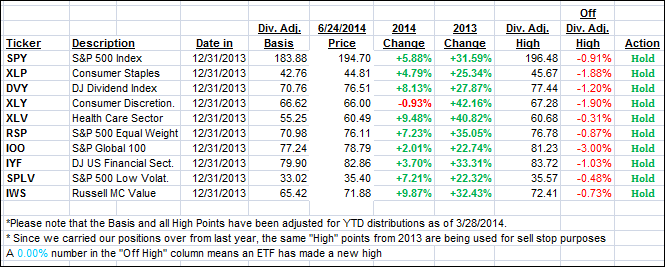
To be clear, the first table above shows the position of the various ETFs in relation to their respective long term trend lines (%M/A), while the second one tracks their trailing sell stops in the “Off High” column. The “Action” column will signal a “Sell” once the -7.5% point is taken out in the “Off High” column.
3. Domestic Trend Tracking Indexes (TTIs)
Our Trend Tracking Indexes (TTIs) gave back some of their recent gains and closed as follows:
Domestic TTI: +3.29% (last close +3.62%)
International TTI: +3.90% (last close +4.50%)
Disclosure: I am obliged to inform you that I, as well as advisory clients of mine, own some of these listed ETFs. Furthermore, they do not represent a specific investment recommendation for you, they merely show which ETFs from the universe I track are falling within the guidelines specified.
Contact Ulli