
1. Moving The Markets
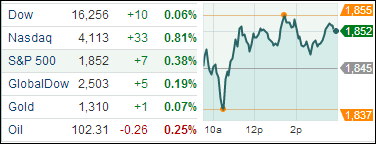
U.S. stocks rose today, snapping a three-day losing streak as investors smiled upon social media and tech shares. Being its volatile self, the S&P is now back in positive territory for the year. Tuesday’s advance followed the S&P 500’s biggest three-day retreat since late January and the Nasdaq’s steepest three-day drop since November 2011. Notable gainers that bounced back from sell-offs over the past couple of days included Amazon.com Inc, (AMZN) up 2.9%; Yahoo Inc, (YHOO) up 2.3% at; and LinkedIn (LKND), up 5.9%
Financial stocks were back in the spotlight today as we received word that regulators finalized the rule to limit banks’ reliance on debt. Under the new rule, the eight biggest U.S. banks must raise a total of about $68 billion in capital by 2018 to comply with a new rule designed to prevent another financial crisis. The rules would apply to JPMorgan Chase, Citigroup, Bank of America, Wells Fargo, Goldman Sachs, Morgan Stanley, BNY Mellon and State Street .
In the international realm, European markets fell as tensions flared again in Ukraine. Russia’s Foreign Ministry warned Kiev on Tuesday that use of force in the eastern region could lead to civil war. Asian markets were mixed Tuesday. Tokyo’s Nikkei fell 1.4% as the central bank ended a policy meeting without any hint of further economic stimulus.
Our 10 ETFs in the Spotlight recovered with one of them making a new high while 9 of them are still positive YTD.
2. ETFs in the Spotlight
In case you missed the announcement and description of this section, you can read it here again.
It features 10 broadly diversified ETFs from my HighVolume list as posted every Monday. Furthermore, they are screened for the lowest MaxDD% number meaning they have been showing better resistance to temporary sell offs than all others over the past year.
In other words, none of them ever triggered their 7.5% sell stop level during this time period, which included a variety of severe market pullbacks but no move into outright bear market territory.
Here are the 10 candidates:
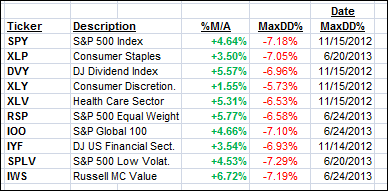
All of them are in “buy” mode meaning their prices are above their respective long term trend lines by the percentage indicated (%M/A).
Year to date, here’s how the above candidates have fared so far:
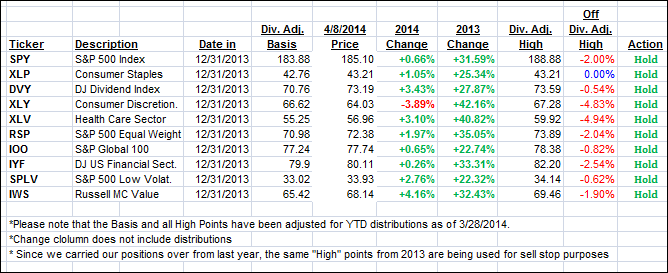
To be clear, the first table above shows the position of the various ETFs in relation to their respective long term trend lines (%M/A), while the second one tracks their trailing sell stops in the “Off High” column.
3. Domestic Trend Tracking Indexes (TTIs)
Our Trend Tracking Indexes (TTIs) rebounded with the markets and closed as follows:
Domestic TTI: +2.13% (last close +1.74%)
International TTI: +3.33% (last close +3.01%)
Disclosure: I am obliged to inform you that I, as well as advisory clients of mine, own some of these listed ETFs. Furthermore, they do not represent a specific investment recommendation for you, they merely show which ETFs from the universe I track are falling within the guidelines specified.
Contact Ulli