
1. Moving The Markets
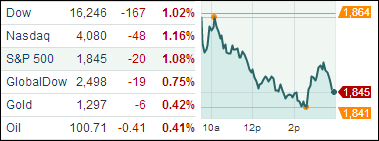
Today officially marks the first day that all three major indexes (S&P, Dow and Nasdaq) are negative year to date. The Nasdaq continued its decline (which began last Thursday) and is now down a combined 4.6% over the three day period. The S&P 500 and Dow Jones both finished down more than 1% each today as well. The buzz is that the recent losses relate to investors rotating out of growth stocks, especially in the tech sector, and reinvesting into value stocks.
Following suit, Internet stocks were among the day’s biggest decliners with Amazon.com (AMZN) down 1.6% and Yahoo! Inc (YHOO) off 3.5%. The Global X Social Media ETF (SOCL.) which includes Groupon Inc (GRPN) and LinkedIn (LNKD) fell 2.5%.
While the recent three day selloff may startle some, overall market sentiment remains positive moving forward. With the big gains that many investors have realized since the beginning of the year, it is not uncommon for a market correction such as this to take place. Volatility has always been on the plate thus far in 2014 though, so do not be surprised to see it continue moving forward. However, this is the time to make sure you have your sell stops in place should this pullback accelerate and turn into an outright bear market. As always, our Trend Tracking Indexes (TTIs), see section 3 below, will be our guide.
Our 10 ETFs in the Spotlight headed south as well but none of them has broken their individual long term trend line to the downside yet; 9 of them are still in the green YTD. Take a look:
2. ETFs in the Spotlight
In case you missed the announcement and description of this section, you can read it here again.
It features 10 broadly diversified ETFs from my HighVolume list as posted every Monday. Furthermore, they are screened for the lowest MaxDD% number meaning they have been showing better resistance to temporary sell offs than all others over the past year.
In other words, none of them ever triggered their 7.5% sell stop level during this time period, which included a variety of severe market pullbacks but no move into outright bear market territory.
Here are the 10 candidates:
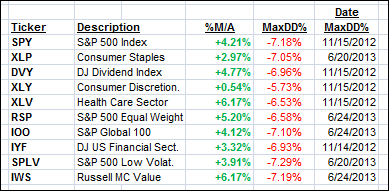
All of them are in “buy” mode meaning their prices are above their respective long term trend lines by the percentage indicated (%M/A).
Year to date, here’s how the above candidates have fared so far:
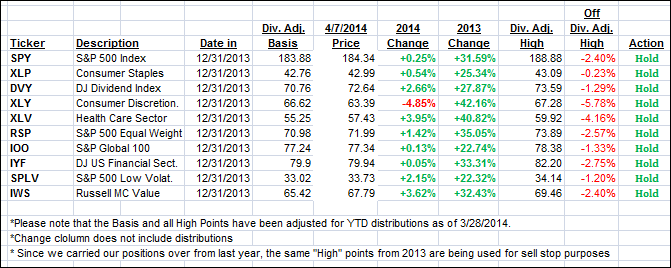
To be clear, the first table above shows the position of the various ETFs in relation to their respective long term trend lines (%M/A), while the second one tracks their trailing sell stops in the “Off High” column.
3. Domestic Trend Tracking Indexes (TTIs)
Our Trend Tracking Indexes (TTIs) are reflecting the weakness in the market place and have moved closer to their respective trend lines. However, more downside momentum is required before our indexes go negative and generate a “Sell” signal:
Domestic TTI: +1.74% (last close +2.31%)
International TTI: +3.01% (last close +3.74%)
Disclosure: I am obliged to inform you that I, as well as advisory clients of mine, own some of these listed ETFs. Furthermore, they do not represent a specific investment recommendation for you, they merely show which ETFs from the universe I track are falling within the guidelines specified.
Contact Ulli