
1. Moving The Markets
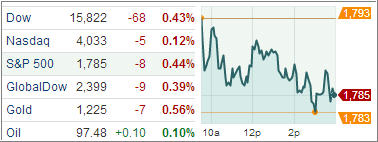
The Dow and the S&P 500 are in their worst stretch since September and are on track to post their first negative week since late September. However, the declines have been slight, with the S&P 500 down about 1.2 percent over the period.
Gross domestic product grew at an annualized rate of 3.6 percent in the third quarter, the fastest pace since the first quarter of 2012 and faster than the 3 percent rate that had been expected. Another report showed that the number of Americans filing new claims for unemployment benefits unexpectedly fell last week in a hopeful sign for the labor market – a day ahead of the November nonfarm payrolls report.
Global markets remain worried alongside the U.S., with Japan’s Nikkei shedding 1.5 percent and The FTSEurofirst 300 index dropping 1% on Thursday.
In emerging markets, The Goldman Sachs Group, Inc. (GS) is now telling the market that next year (2014) will not only be the “Year of the Horse” in the Chinese Zodiac, but it will also be a buying opportunity in Chinese stocks (FXI). Goldman Sachs is predicting that the Hong Kong-based Hang Seng China Enterprises Index, which is available for investment by foreign investors, will surge 19% in 2014. So far, the trends in FXI don’t support those ideas as FXI has been stuck in a wide sideways pattern since 2009.
Our ETFs in the Spotlight retreated with the indexes but have come off their highs only modestly as the chart below shows:
2. ETFs in the Spotlight
In case you missed the announcement and description of this section, you can read it here again.
It features 10 broadly diversified ETFs from my HighVolume list as posted every Monday. Furthermore, they are screened for the lowest MaxDD% number meaning they have been showing better resistance to temporary sell offs than all others over the past year.
In other words, none of them ever triggered their 7.5% sell stop level during this time period, which included a variety of severe market pullbacks but no move into outright bear market territory.
Here are the 10 candidates:
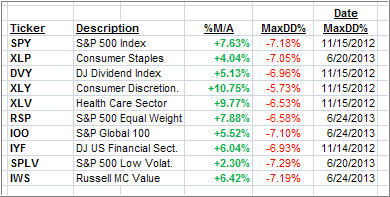
All of them are in “buy” mode meaning their prices are above their respective long term trend lines by the percentage indicated (%M/A).
Now let’s look at the MaxDD% column and review the ETF with the lowest drawdown as an example. As you can see, that would be XLY with the lowest MaxDD% number of -5.73%, which occurred on 11/15/2012.
The recent sell off in the month of June did not affect XLY at all as its “worst” MaxDD% of -5.73% still stands since the November 2012 sell off.
A quick glance at the last column showing the date of occurrences confirms that five of these ETFs had their worst drawdown in November 2012, while the other five were affected by the June 2013 swoon, however, none of them dipped below their -7.5% sell stop.
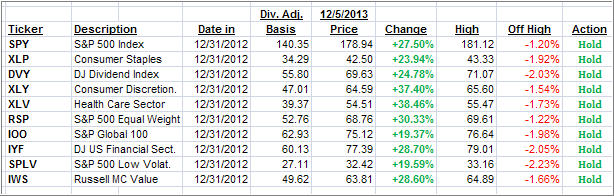
Year to date, here’s how the above candidates have fared so far:
3. Domestic Trend Tracking Indexes (TTIs)
Trend wise, our Trend Tracking Indexes (TTIs) slipped a bit but remain above their long term trend lines by the following percentages:
Domestic TTI: +4.01% (last close +4.17%)
International TTI: +5.65% (last close +5.95%)
Disclosure: I am obliged to inform you that I, as well as advisory clients of mine, own some of these listed ETFs. Furthermore, they do not represent a specific investment recommendation for you, they merely show which ETFs from the universe I track are falling within the guidelines specified.
Contact Ulli