Sunday Musings: M-Index Rankings

Ulli Uncategorized Contact


The M-Index rankings featured in my
weekly StatSheet provide assistance in making proper fund/ETF selections when buy signals are being generated.

The best time to utilize the ranking system is at the beginning of a buy cycle, right after trend lines have been crossed to the upside. In other words, we are looking at bear market territory in the rear view mirror and therefore are approaching the trend lines from a level below.

In the context of the ranking food chain, reader John had this question:

I want to make sure I am on the same page as you.

Assume I want in the market now and buy your top 6 M-rated funds/ETFs with a 7% trailing stop. Do I just continue to hold those till I either get stopped out or get a sell signal?

And when I get stopped out, do I then buy the top rated M-rated ETFs on your list as a replacement?

The short answer is yes and no. The current bull market, which started according to my trend tracking approach on 6/3/2009, is now some 15 months old. During this period, we have seen stunning rallies and tremendous market collapses.

More recently, economic news reports have been negative with the major indexes now hovering below their respective long-term trend lines, while our domestic Trend Tracking Index (TTI) still hovers in bullish territory by +2.01%.

In other words, our domestic TTI is now approaching its trend line from a level above and not from below. Sure, if you are an aggressive investor, you can pick some of the few domestic funds that are still ranked positive by the M-Index.

However, if you look at their respective positions, relative to their long-term trend lines (column %M/A), you’ll find that they are all in negative territory. That means, despite our domestic TTI still being bullish, the funds/ETFs listed in the StatSheet are predominantly bearish.

If you are looking to invest in this environment, the domestic market nor the international one, are not the areas to focus on. Sector and Country funds, along with bond ETFs, offer far better momentum numbers at this time.

Again, you need to be the aggressive type to establish a position right now. If you do, my suggestion is to always drop down the rankings by a few notches so that you don’t get stopped out unnecessarily. The higher the ranking, the higher the volatility! That is why I recommend the use of a 10% trailing stop loss for Country and Sector funds/ETFs.

If you get stopped out, you need to reevaluate as to what area, if any, momentum has shifted to. If momentum numbers approach zero, or are negative, this is not the time to try to be a hero and engage in bottom fishing. Wall Street is littered with bodies who were convinced that “the market simply can’t go any lower.”

ETF Liquidation

Ulli Uncategorized Contact

With over 1,000 ETFs now being on the market, there are bound to be some that simply don’t make it and end up folding shop.

So what do you do if you get stuck with an ETF that is about to liquidate?

Here are some thoughts on that topic in “How To Survive An ETF Liquidation:”

The last two weeks have seen two separate announcements of ETF closures, with Claymore and Grail both making plans to shutter funds that have failed to catch on with investors. Claymore will close four equity funds that maintained aggregate assets of about $35 million (IRO, CRO, EXB, and ROB) while Grail is closing the doors on two actively-managed funds that each maintained about $3 million in assets. So far in 2010, about 30 ETFs have been closed; WisdomTree gave 10 funds the ax in February and Rydex pulled the plug on most of its leveraged ETF lineup in April.

Odds are that the next several years will see a wave of consolidations and closures in the ETF space. According to the most recent data from the National Stock Exchange, more than 350 ETFs maintain total assets of less than $25 million. Many of those funds are relatively new, and are just hitting the sweet spot on their growth curve. GXG is a good example of an ETF that grew up slowly; the Colombia ETF launched in early 2009 and as recently as June 2010 had just $13 million in assets. In the two months since, assets have surged to more than $50 million [see The Colombia ETF’s Secret Sauce].

But many ETFs with under $25 million in assets are unlikely to ever generate significant interest from investors, and many are likely operating in the red (the exact breakeven point obviously depends on the expense ratio and other details). Since ETF issuers don’t like losing money, that means that hundreds of funds could be headed to the big trading floor in the sky.

The process for winding down an ETF is generally very similar across different issuers. A final trading day is announced, and shareholders in the fund after that date will have their shares automatically redeemed for cash on the last day of operations. So investors in a fund that is shutting down generally have two options: 1) sell shares ahead of the final trading day or 2) hold on to the shares until the final cash distribution is made [also read Myths About ETF Liquidity].

There’s another risk for investors who elect to hold on to their position until the ultimate cash distribution. “As a fund sells its last positions, it has the potential to realize capital gains if any of the positions have appreciated,” writes Matt Hougan. “Any gains are then distributed along with the cash proceeds to redeeming investors.” Such a scenario potentially eliminates the tax efficiency advantage that ETFs boast over mutual funds, and leaves investors with unwanted capital gains. Of course selling shares in the days leading up to the closure of an ETF can also lead to investors incurring capital gains.

Each liquidation scenario is different; trading premiums/discounts, treatment of closing costs, and potential capital gains can change the strategy for navigating the final few days of an ETF’s life. If you’re able to close out of the position at the NAV and without incurring unwanted tax consequences, it probably makes sense to do so and avoid any uncertainty as the shuttering approaches. If not, it’s time to measure the costs of each scenario and determine the best path.

To me, the way to solve that issue is not to get involved with an ETF in the first place, if it might face an early demise. How can you be certain?

While you never can be 100% sure, a clue would be the size of an ETF and its daily trading volume. There are a host of ETFs that remain tiny even after a year on the market. Others may grow in size but volume remains puny and bid/ask spreads are high.

In the final analysis, the tiebreaker as to whether an ETF is worthy your attention, or is simply in survival mode, should be average daily volume. In my advisor practice, I have filtered out any ETF with less than an average daily volume of $10 million. After removing redundancy, I ended up with a list, which contains only 81 ETFs.

That covers just about all areas of the investment spectrum and leaves me only with those that are established and therefore have very little chance of facing liquidation.

No Load Fund/ETF Tracker updated through 8/26/2010

Ulli Uncategorized Contact

My latest No Load Fund/ETF Tracker has been posted at:

http://www.successful-investment.com/newsletter-archive.php

Today’s rally wiped out some of the losses from earlier in the week, but the major indexes still closed down slightly.

Our Trend Tracking Index (TTI) for domestic funds/ETFs held above its trend line (red) by +2.01% (last week +2.48%) and remains in bullish mode.


The international index has now broken below its long-term trend line by -0.73% (last week -0.36%). A Sell signal was triggered effective 8/25/10, and we remain out of this market for the time being.

[Click on charts to enlarge]
For more details, and the latest market commentary, as well as the updated No Load Fund/ETF Tracker StatSheet, please see the above link.

Mounting A Comeback

Ulli Uncategorized Contact


Despite worse than expected new-home sales and industrial production numbers, the markets managed a rebound yesterday by reversing an early 100 point drop of the Dow. The gains were modest, but at least it was an up day.

Today could prove to be another difficult one as the weekly report on jobless claims is on the agenda. Any more signs of a deteriorating job market could send the major indexes lower.

As I posted yesterday, the early selling ran into some support at the S&P; 500 1,040 level, which turned out to be the low of the day. A close below would be another sign of bearishness and would bring 1,000 level into play.

If the markets make it through today’s jobless claims numbers without too much damage, we may still face a severe headwind on Friday when the GDP second quarter estimates are released. If more evidence of a slowing economy surfaces, this market has no other way to go but down, which will bode well for all bond holdings.

Positive numbers are definitely needed to put a floor under this month’s sell off, which has the S&P; 500 down by -4.3% so far.

Hanging On To Dow 10k—International Sell Signal Generated

Ulli Uncategorized Contact

If you were bullish on equities, there was nothing to like about yesterday’s trading activity. Existing home sales took front and center and with sales having dropped by over 27% to levels last seen in 1995, stocks got hammered and closed at their lowest level in about 7 weeks.

As has been the norm, the home sale decline was greater than economists expected. However, that is simply a consequence of artificially trying to stimulate housing markets in this case via the now expired tax credit program. Housing will now have to stand on its own two legs, unless Stimulus 2.0 is being created.

Expect to see similar results with upcoming reports in those areas of the economy that received a healthy dose of Stimulus 1.0.

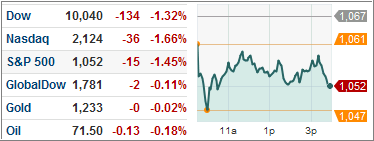
The good news was that the markets did not close at their intra-day lows as the chart shows, although the Dow barely hung on to the psychologically important 10k level—at least for the time being.

Our international Trend Tracking Index (TTI) had peeked into bear market territory during the past few trading days. Today, it clearly pierced its long-term trend line to the downside, thereby generating a Sell signal. The effective date for tracking will be today, August 25, 2010. This brings to an end a rather short international buy cycle (7/26/10-8/25/10), which is actually the shortest in past 21 years of its existence.

As of today the TTIs stand as follows:

Domestic TTI: +2.05%
International TTI: -1.39%

Again, bonds were the beneficiary of this downturn. It remains to be seen if the market, as measured by the S&P; 500, will find support at the 1,040 level and shoot back up to the 1,100 resistance point. My guess is that any further negative news will have us testing 1,000 before we will see 1,100 again.

Track and execute your sell stops, if you still own any equity positions.

Slipping And Sliding

Ulli Uncategorized Contact


Despite an initial upward thrust, the markets meandered aimlessly during the remainder of yesterday’s session, then gave up their gains and faded into the close.

While the losses were manageable, trading activity was nevertheless a sign of uncertainty about the future status of the economy. Bonds were the beneficiary again, as they have been for most of this year, with questions about the recovery causing yields to sink almost on a daily basis.

Very light volume, along with the summer doldrums, and many traders being on vacation, may keep the major indexes stuck in a range during the remaining trading days until Labor Day. Barring any surprising positive news, the fears about a fading global recovery will be foremost on traders’ minds causing the bond rally to continue.

Again, just like with any position, a sell stop for bond ETFs/funds is essential. Personally, the number for me is somewhat smaller than for equities, as I prefer to use 5% on a trailing basis using closing prices only.

Main stream media has been out in full force predicting the imminent demise of the bond rally. Since the media are usually 100% wrong with their assessments, it is safe to assume that there is more room to the upside, especially if the economy tanks.

Good economic news (or some Black Swan event) could end the bond rally, which is why we have a sell stop discipline in place; this helps us not to have to make emotional investment decisions and/or listen to silly predictions.