Golden Cross Vs. Death Cross – Are These Meaningful Technical Indicators?

Ulli Market Review Contact

Europe is falling apart but the S&P 500 is having its best start to the year since 1989. I’m sure you are puzzled as to why equities have gone full steam ahead despite less than stellar fundamentals. While I believe this recent run-up will not last in the long-run, there are indicators that might suggest otherwise. Perhaps the answer as to where we’re going lies in the technicals.

The crossing of 50-day and 200-day moving averages is a key buy and sell trigger for some technical analysts. The Golden Cross is when the 50-day moving average crosses above the 200-day moving average, thereby generating a buy signal. Conversely, the Death Cross occurs when the 50-day moving average crosses below the 200-day moving average, resulting in a sell signal.

Seeing as a Golden Cross just happened this past Tuesday (January 31), does that mean we should go into major buy mode? Let’s get at the devil in the details.

Read More

02-03-2012

Ulli Newsletter Archives Contact

ETF/No Load Fund Tracker Newsletter For Friday, February 3, 2012

ETF/No Load Fund Tracker StatSheet

————————————————————-

THE LINK TO OUR CURRENT ETF/MUTUAL FUND STATSHEET IS:

https://theetfbully.com/2012/02/weekly-statsheet-for-the-etfno-load-fund-tracker-newsletter-updated-through-02022012/

————————————————————

Market Commentary

Friday, February 3, 2012

BULLS KEEP ROARING FOR DOMESTIC ETFS

Markets continued their upward trajectory, pushing more into bull territory. The S&P 500 jumped 1.46% while the NASDAQ rose 1.61% to hit its highest level since December 2000. The optimism was also shared by European and Asian indices.

More evidence of pendulum behavior in Treasury yields, the 10-year Treasury shot up to 1.95%. Like I’ve said before, although volatility has largely been absent lately, we are in a relatively risky investment environment considering what’s going on in Europe.

In the major news of the day, U.S. unemployment fell to 8.3% in January, the lowest level since February 2009. Nevertheless, there was a decrease in labor force participation, although the Bureau of Labor Statistics says that this is due to population growth among the elderly and young who have lower rates of labor force participation (see page 6 of this). While there’s still a long way to go on the employment front, it’s definitely an encouraging sign.

On the international stage, it looks like Greece might be coming to a close on talks with its creditors. Nonetheless, labor reform is the contentious issue as various parties are putting pressure on Greece to institute wage and pension cuts.

To make things worse, debt inspectors say that Greece may require additional funds on the order of roughly $20 billion just to bring its debt-to GDP ratio down to 120%. As the clock ticks for Greece to obtain approval for a second bailout package, I can only wonder if the Greeks will agree to a new deal, and if so, whether it can get itself back on the financial straight and narrow or end up being debt slaves to the European banks forever.

A sign that economic weakness in the Eurozone persists, December retail sales were down 0.4% in the region despite the fact that it was the holiday season. Markets might be responding positively at the moment, but the real economy continues to suffer.

While our Domestic TTI remains in positive territory by a solid +5.21%, the International TTI finally broke above its trend line by +2.48%. While the International TTI is now positive, I’m not yet comfortable issuing a buy signal for international ETFs, as I want to see a little more stability over the coming few trading days.

The picture is still gloomy internationally and not much better in the U.S. But given recent trends, we have to participate on some of this upside while being prepared for a negative shock by using our trailing stop loss points.

Have a great week.

Ulli…

————————————————————-

READER Q & A FOR THE WEEK

All Reader Q & A’s are listed at our web site!
Check it out at:

http://www.successful-investment.com/q&a.php

A note from reader Don:

Q: Ulli: I am sitting with a nice profit with VEU and VNQ. 8-10% range. With the market widely fluctuating, at what point would one consider taking profits and buying back later?

I hate to see this disappear by having a 7% trailing stop should the market go down. I realize there may not be a perfect answer to this. Thanks for the excellent site.

A: Don: You are right, there is no perfect answer. My preference is to use trailing sell stops as my signal when to take profits or limit losses, whichever case it may be. If you’re happy with your current gains and are worried about giving them back, simply take them.

———————————————————-

WOULD YOU LIKE TO HAVE YOUR INVESTMENTS PROFESSIONALLY MANAGED?

Do you have the time to follow our investment plans yourself? If you are a busy professional who would like to have his portfolio managed using our methodology, please contact me directly or get more details at:

https://theetfbully.com/personal-investment-management/

———————————————————

Back issues of the ETF/No Load Fund Tracker are available on the web at:
https://theetfbully.com/newsletter-archives/

ETF/No Load Fund Tracker Newsletter For Friday, February 3, 2012

Ulli ETF Tracker Contact

ETF/No Load Fund Tracker StatSheet

————————————————————-

THE LINK TO OUR CURRENT ETF/MUTUAL FUND STATSHEET IS:

https://theetfbully.com/2012/02/weekly-statsheet-for-the-etfno-load-fund-tracker-newsletter-updated-through-02022012/

————————————————————

Market Commentary

Friday, February 3, 2012

BULLS KEEP ROARING FOR DOMESTIC ETFS

Markets continued their upward trajectory, pushing more into bull territory. The S&P 500 jumped 1.46% while the NASDAQ rose 1.61% to hit its highest level since December 2000. The optimism was also shared by European and Asian indices.

More evidence of pendulum behavior in Treasury yields, the 10-year Treasury shot up to 1.95%. Like I’ve said before, although volatility has largely been absent lately, we are in a relatively risky investment environment considering what’s going on in Europe.

In the major news of the day, U.S. unemployment fell to 8.3% in January, the lowest level since February 2009. Nevertheless, there was a decrease in labor force participation, although the Bureau of Labor Statistics says that this is due to population growth among the elderly and young who have lower rates of labor force participation (see page 6 of this). While there’s still a long way to go on the employment front, it’s definitely an encouraging sign.

Read More

Weekly StatSheet For The ETF/No Load Fund Tracker Newsletter – Updated Through 02/02/2012

Ulli ETF StatSheet Contact

ETF/Mutual Fund Data updated through Thursday, February 2, 2012

If you are not familiar with some of the terminology used, please see the Glossary of Terms.


1. DOMESTIC EQUITY MUTUAL FUNDS/ETFs: BUY — since 10/25/2011

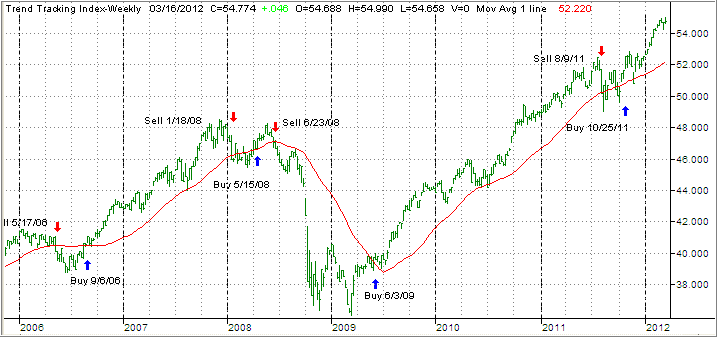
The domestic TTI broke through its long-term trend line generating a Sell for this area effective 8/9/2011. Over the recent past, we’ve seen the TTI hovering slightly below and above this dividing line between bullish and bearish territory. The clear break to the upside occurred on 10/24/11 and, effective 10/25/11, a new Buy signal for domestic equities is in effect.

As of today, our Trend Tracking Index (TTI—green line in above chart) has broken above its long term trend line (red) by +4.82%. Be sure to tune into my blog for the latest updates.

Read More

Markets Keep Fumbling Along – Equity ETFs On Standby For Jobs Report

Ulli Market Review Contact

[Chart courtesy of MarketWatch.com]

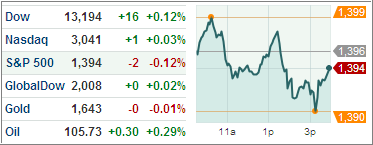
After some big gains yesterday, markets returned to more stability today. The S&P 500 inched up 0.11% while European indices such as the DAX were in the green. In addition, the Euro was essentially flat, sticking to $1.31/Euro.

Although the VIX dropped over 3% to fall below 18, the 10-year Treasury dipped to a yield of 1.83%. Thus, although we’ve seen a substantial decrease in equities volatility in the last couple months, investors have been flooding into Treasuries. From this standpoint, we’re in a risky investment landscape.

In Europe, Greek debt restructuring discussions have hit a temporary standstill. The question is now whether Greece can implement wage and pension reform, an impediment to its ability to pay down its debt while reducing the country’s competitiveness.

Ultimately, I believe Greece lacks the wherewithal to regain economic strength if it stays in the Eurozone. Even if it receives bailout funds, the looming prospect of a future disorderly default is simply too great a risk.

Read More

January Optimism Seeps Into February For ETFs

Ulli Market Review Contact

[Chart courtesy of MarketWatch.com]

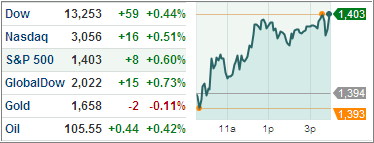
January’s gains extended into this month as the S&P 500 jumped 1.12% while European and Asian indices were also in bullish mode.

Meanwhile, the Euro rose to $1.32/Euro while the 10-year Treasury rose to a yield of 1.83%. Although market volatility has tempered, there is still plenty of risk lying around.

The head of the IMF recovery effort in Greece, Poul Thomsen, conceded that austerity will only have a negative impact on Greece. Although the debt needs to be cut, stunting economic growth will put Greece back even further. As I’ve previously reiterated, the cards are stacked against Greece and throwing more bailout funds is no guarantee that Greece can get back on a fiscally responsible track.

Read More