02-10-2012

Ulli Newsletter Archives Contact

ETF/No Load Fund Tracker Newsletter For Friday, February 10, 2012

ETF/No Load Fund Tracker StatSheet

————————————————————-

THE LINK TO OUR CURRENT ETF/MUTUAL FUND STATSHEET IS:

https://theetfbully.com/2012/02/weekly-statsheet-for-the-etfno-load-fund-tracker-newsletter-updated-through-02092012/

————————————————————

Market Commentary

Friday, February 10, 2012

MAJOR MARKET ETFS FINALLY HIT THE RED

After several days of gains, markets finally dropped, with the S&P 500 falling a modest 0.69%. European and Asian indices were more substantially in the red. In commodities, oil and gold were also down.

Demonstrating the volatility in fixed income, the 10-year Treasury fell below 2% to a yield of 1.97%. Most startlingly, the VIX had a massive jump of 11.65% to rise above the 20 level. We’ll have to see if this foreshadows more volatility in the near future.

If anything causes a bigger spike in volatility, it would likely be the effect of an unfavorable outcome in Greece, especially if it’s unexpected. Greece not only has internal dissension, but it must finalize a deal with will be agreeable with bondholders and the troika. From my point of view, we’re on high risk alert.

Although Greece made some progress yesterday, the tension is greater than ever. Not only are unions upping the ante with more strikes, but five Greek politicians resigned due to disagreement over austerity measures. Papademos is in a tight spot as some politicians want to go ahead with the fiscal cuts in order to receive bailout funds and keep Greece in the Eurozone while others can’t muster the nerve to accept the cuts and face public backlash.

While Greece worries about getting its bailout money, it appears that Portugal will need more aid than expected. Germany’s finance minister hinted that the planned $100 billion plus bailout package may not be enough, especially as Portugal’s borrowing costs for medium-term to long-term debt are well into double digits.

In the U.S., dismal housing numbers are not going away, prompting Bernanke once again to stress the importance of a turnaround in housing to help the U.S.’s economic fortune. Despite a decrease in mortgage rates, housing hasn’t dramatically improved.

With regards to our Trend Tracking Indices, our Domestic TTI is currently sitting at +4.89%, giving us justification to hold on to our domestic equity ETF exposure. Meanwhile, for the first time since September 2010, we’ve generated a buy signal for international equity ETFs, as the International TTI has emerged from bear territory (as posted on 2/7/12) to sit at +1.96%. Nevertheless, we want to be more cautious in the international sphere where there is more volatility.

This past week was generally mild in terms of market activity, but in the wake of today’s big jump in volatility and further signs of strain in Europe, we’ll have to see if next week brings more downside. Make sure you have your trailing stop losses implemented in case this happens.

Have a great week.

Ulli…

————————————————————-

READER Q & A FOR THE WEEK

All Reader Q & A’s are listed at our web site!
Check it out at:

http://www.successful-investment.com/q&a.php

A note from reader GH:

Q: Ulli: “Concerns linger over the European banking system with regards to capital shortfalls. There is speculation that a number of banks that submitted proposals for achieving capital adequacy might still not reach a necessary target of 9% tier one capital. With 30 banks that collectively need roughly $150 billion in capital to meet this target…”

I don’t know why there should be any concern. As we’ve learned in the age of intervention (since March 2009), targets move. Sometimes targets disappear…and new ones appear.

Honestly, I think that idea has a lot to do with why markets are less volatile and steadily moving upward now. Can investors be blamed for becoming complacent?

I’ve been overly skeptical of long positions for years now. And I’ve only recently become more “daring” when moving money into ETF’s. And my idea of daring is increasing positions in consumer staples!

Do you think I’m a good measure of market direction to the upside, or a contrarian indicator that screams “SELL”!? (tongue-in-cheek)

A: GH: Well, you could be a contrarian indicator…

I agree with what you said in terms of targets and your overall skepticism. That’s why my preference is not to make market interpretations but let the trends be my guide. I have found over the past 25 years that my personal assumptions and opinions are not necessarily aligned with market direction.

It’s far more effective to follow the long-term trends and use trailing sell stops to control downside risk while accepting the fact at the same time that you will be wrong occasionally and that subsequent whipsaw signals are simply part of the equation.

———————————————————-

WOULD YOU LIKE TO HAVE YOUR INVESTMENTS PROFESSIONALLY MANAGED?

Do you have the time to follow our investment plans yourself? If you are a busy professional who would like to have his portfolio managed using our methodology, please contact me directly or get more details at:

https://theetfbully.com/personal-investment-management/

———————————————————

Back issues of the ETF/No Load Fund Tracker are available on the web at:

https://theetfbully.com/newsletter-archives/

ETF/No Load Fund Tracker Newsletter For Friday, February 10, 2012

Ulli ETF Tracker Contact

ETF/No Load Fund Tracker StatSheet

————————————————————-

THE LINK TO OUR CURRENT ETF/MUTUAL FUND STATSHEET IS:

https://theetfbully.com/2012/02/weekly-statsheet-for-the-etfno-load-fund-tracker-newsletter-updated-through-02092012/

————————————————————

Market Commentary

Friday, February 10, 2012

MAJOR MARKET ETFS FINALLY HIT THE RED

After several days of gains, markets finally dropped, with the S&P 500 falling a modest 0.69%. European and Asian indices were more substantially in the red. In commodities, oil and gold were also down.

Demonstrating the volatility in fixed income, the 10-year Treasury fell below 2% to a yield of 1.97%. Most startlingly, the VIX had a massive jump of 11.65% to rise above the 20 level. We’ll have to see if this foreshadows more volatility in the near future.

If anything causes a bigger spike in volatility, it would likely be the effect of an unfavorable outcome in Greece, especially if it’s unexpected. Greece not only has internal dissension, but it must finalize a deal with will be agreeable with bondholders and the troika. From my point of view, we’re on high risk alert.

Read More

Weekly StatSheet For The ETF/No Load Fund Tracker Newsletter – Updated Through 02/09/2012

Ulli ETF StatSheet Contact

ETF/Mutual Fund Data updated through Thursday, February 9, 2012

If you are not familiar with some of the terminology used, please see the Glossary of Terms.


1. DOMESTIC EQUITY MUTUAL FUNDS/ETFs: BUY — since 10/25/2011

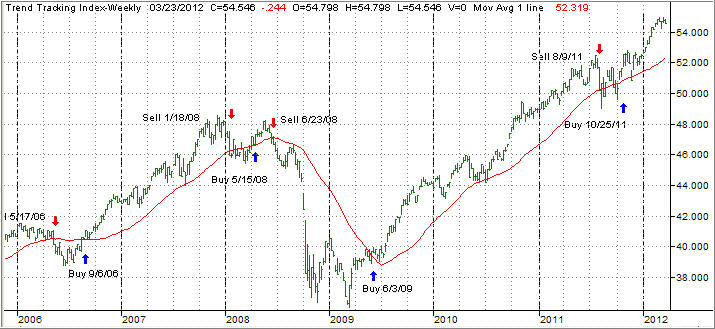
The domestic TTI broke through its long-term trend line generating a Sell for this area effective 8/9/2011. Over the recent past, we’ve seen the TTI hovering slightly below and above this dividing line between bullish and bearish territory. The clear break to the upside occurred on 10/24/11 and, effective 10/25/11, a new Buy signal for domestic equities went into effect.

As of today, our Trend Tracking Index (TTI—green line in above chart) has broken above its long term trend line (red) by +5.08%. Be sure to tune into my blog for the latest updates.

Read More

Greek Deal Or No Deal: What’s Next For ETFs?

Ulli Market Review Contact

[Chart courtesy of MarketWatch.com]

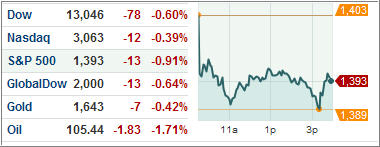
With Greece making headway in its bailout deal today, the S&P 500 had a minor gain of 0.15% while European markets finished on the upside. The Euro also edged up to $1.33/Euro.

And once again, the 10-year Treasury breached the 2% level, finishing at a yield of 2.05%. It looks like the Greek news tempered investor fear for the time being, but it doesn’t mean that risk has substantially dissipated.

After a tussle amongst various political parties, Greece agreed to a roughly $4.3 billion austerity package as it seeks to demonstrate it can reign in fiscal discipline. While no guarantee that this measure will help Greece receive its bailout payment, it sure increases Greece’s chances.

However, there’s a lot of negotiating left and plenty of things that can still go wrong, leaving Greece in the danger zone where it has only bought itself some extra time.

Read More

Low Volatility Continues for ETFs

Ulli Market Review Contact

[Chart courtesy of MarketWatch.com]

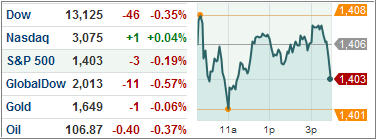
Markets moved forward once again as the S&P 500 rose 0.22%. Nevertheless, European markets erred to the downside. While it seems like markets have discounted the Greek situation, there’s no promise that market price stability will persist.

Overall, there wasn’t much volatility across U.S. indices, currencies, Treasuries, or commodities today. The VIX went up over 2%, but this pales in comparison to the major price swings we witnessed in late 2011.

Meanwhile, an emergency meeting will be held among European finance ministers to discuss Greece. Greek PM Papademos finally met with party leaders today after delays to try and iron out a resolution. Whether Greece can institute fiscal reforms such as a 20% minimum wage cut remains the big unknown. Ultimately, a 50%-70% haircut on current bonds with the promise of new bonds is no cure for Greece’s financial irresponsibility. Renewed fiscal discipline must come from within the political coffers.

Read More

7 ETF Model Portfolios You Can Use – Updated through 2/7/2012

Ulli Model ETF Portfolios Contact

January’s upward momentum continued into February, as the S&P 500 jumped some 2.6% since last week’s ETF Model Portfolio report. All models moved higher as well with 3 of them (#3, #4, #5) outperforming the index on a YTD basis.

While that is nice, it is not nearly as important as having some kind of diversification for that moment when downside risk kicks in again. It’s just a matter of time for this rally to run into some kind of a stumbling block, which is why it’s crucial for you to have your exit strategy in place.

If you follow these models, you will find the sell stop tracking on the right hand side of each matrix.

Take a look at the latest ETF Model Portfolio update:

Read More