Last Week In Review: ETF News And Blog Posts To 7/8/2012

Ulli Market Review Contact

In case you missed it, here’s a summary of the ETF topics and market reviews I posted to my blog during the week ending on 7/8/2012.

The S&P 500 ran out of stream last week after post EU summit euphoria waned while the horrific US jobs report pushed the index to a weekly loss.

The outcome could have been much worse last Friday, but whenever the markets show too much weakness, a well placed rumor can always save the day. This time, it came in form of renewed Q&E hopes that pulled the indexes up and avoided a close at the day’s lows.

Next week, we will be facing the start of the earnings season along with the usual attention grabbing headlines out of Europe about a new mysterious solution to solve all debt issues. It will be interesting to say the least.

This week, we covered the following:

Read More

European Central Bank: No Need For Immediate Non-Standard Measures

Ulli Market Commentary Contact

Following last Friday’s “successful” EU summit in Brussels, global markets were euphoric amid talks of “breakthrough” in the ongoing deadlocked negotiations.

However, as they say, the ‘devil lies in the detail.’ For example, the EU leaders have agreed that the proposed new EU-wide banking regulator will not be set up before the end of 2012. Since issues of national control and sovereignty are involved, chances of the proposed euro-wide central bank supervisory council getting delayed or not taking off at all is very real.

Also, agreement over routing funds from the region’s bailout funds, the EFSF and the ESM, directly to the region’s banks rather than through the national governments in order to keep sovereign debt levels low, goes against the tenets of the European Council, because EU rules allow lending to governments only due to lack of control over foreign banks.

One possible condition to channel funds directly to the banks, as legitimately demanded by the Germans, can be underwriting of loans by national governments, thus compensating for probable losses suffered by the EFSF and the ESM.

However, Benoit Coeure, Executive Board Member of the European Central Bank, doesn’t think non-standard policy measures such as further Long Term Repurchase Operations or quantitative easing, are required immediately.

Read More

New ETFs On The Block: First Trust North American Energy Infrastructure Fund (EMLP)

Ulli Master Limited Partnerhips Contact

Illinois-based ETF issuer First Trust has launched its first actively managed ETF that looks to latch on the tax benefits of MLPs with the North American Energy Infrastructure Fund (EMLP).

The new product propels Firsts Trust into the highly competitive, but popular MLP world where there are already 10 other products managing about $8 billion in assets.

Investors looking for high-yield funds in the current low-yield environment may consider EMLP since it invest in firms that are in the energy infrastructure sector including Master Limited Partnerships (MLP), Limited Liability Partnerships taxed as partnerships, pipeline and utilities and Canadian income trusts that generate at least half of their revenues from infrastructure assets such as petroleum and natural gas storages, pipelines and power transmissions.

North American energy infrastructure has witnessed heightened investor interest in recent times partly because MLPs are required to distribute significant amount of their earnings to claim certain tax advantages. Hence these particular classes of funds are popular for hefty yields in these times of record low interest rates.

Read More

06-07-2012

Ulli Newsletter Archives Contact

ETF/No Load Fund Tracker Newsletter For Friday, July 6, 2012

ETF/No Load Fund Tracker StatSheet

————————————————————-

THE LINK TO OUR CURRENT ETF/MUTUAL FUND STATSHEET IS:

https://theetfbully.com/2012/07/weekly-statsheet-for-the-etfno-load-fund-tracker-newsletter-updated-through-07052012/

————————————————————

Market Commentary

Friday, July 6, 2012

EQUITY MARKETS END LOWER AS JOB GROWTH DISAPPOINTS; ZROZ FLOATS, UNG LEAKS

US equities slumped Friday with the Dow Industrials and the S&P 500 finishing the week lower following a US Labor Department report that showed employers added fewer than estimated jobs in June.

Treasuries advanced for the second straight day as investors sought refuge in safe-haven assets in anticipation of another round of assets purchase by the Federal Reserve to boost a faltering job market.

The Dow Jones Industrial Average (DJIA) slipped 0.96 percent to end the day at 12,772.47, off 0.8 percent for the week. Only five of the 30 components within the blue-chip index ended in the positive region.

Ten year Treasuries capped the month on a high after jobs data showed employers added only 80,000 jobs in June, well short of the projected 100,000. Compared to 226,000 jobs a month in the first quarter, hiring in the second quarter dropped sharply to 75,000.

The S&P 500 Index (SPX) lost 0.9 percent to finish at 1354.68, off 0.6 percent for the week. The index has closed lower in the last two of the three weeks.

Yield on the 10-year Treasury dropped five basis points to 1.54 percent in late afternoon trading, New York time, off 10 basis points for the week, the highest since in more than a month. 30-year bond yields fell six basis points to 2.66 percent as unemployment held at 8.2 percent for the second consecutive month.

ETFs in the news:

As US stocks fell about one percent on jobs selloff, investors rushed to the relative safety of government bonds, anticipating further rounds of assets purchase by the US Fed to prop up the sagging job market.

The PIMCO 25 Year Zero Coupon U.S. Treasury Index Fund (ZROZ) emerged among the winners, adding 1.58 percent for the day. The bond fund is up an impressive 6.65 percent year-to-date and is currently trading close to its 52-week highs.

Other long-term US debt funds such as the Vanguard Extended Duration Treasury ETF (EDV) and the iShares Barclays 20 Year Treasury Bond Fund (TLT) also made impressive gains, adding 1.34 percent and 0.93 percent, respectively.

It was a bad day for commodities across the board, led by energy and precious metals. Natural gas sank 5.6 percent on the day while WTI crude slipped 3.5 percent. Agricultural commodities also softened for the first time in days, with wheat, corn and soybeans ending the day’s session lower.

The United States Natural Gas Fund LP (UNG) crashed Friday, plummeting 5.33 percent on the day.  Agricultural ETFs such as the DB Agriculture Double Long ETN (DAG) and the UBS E-TRACS CMCI Agriculture Total Return ETN (UAG) gapped lower for the day, shedding 3.74 percent and 2.62 percent respectively.

Our Trend Tracking Indexes (TTIs) vacillated with the markets and ended the week as follows:

Domestic TTI: +2.63% (last week +2.38%)

International TTI: -2.23% (last week -2.15%)

Have a great week.

Ulli…

Disclosure: No holdings

————————————————————-

READER Q & A FOR THE WEEK

All Reader Q & A’s are listed at our web site!
Check it out at:

http://www.successful-investment.com/q&a.php

A note from reader HB:

Q: Ulli: If I can get an overall feel from your report, the M-index is the momentum, but also higher momentum means higher risk. Would it be safe to say, in general, if I look at the DD% (0 being at high), I should look for the DD% first, then % ma, then M-index?

I know there is no real formula, but was hoping to put together a formula I could plug #s into to provide “my” best option.

A: HB: Where the markets are at currently, your best bet is to use one of the model ETF portfolios as opposed to stringing together a variety of ETFs. Pick the one that best suits your risk tolerance. They have a mix of bonds and equities to balance out market fluctuations and, when used with my recommended sell stop discipline, will clearly define your downside risk.

———————————————————-

WOULD YOU LIKE TO HAVE YOUR INVESTMENTS PROFESSIONALLY MANAGED?

Do you have the time to follow our investment plans yourself? If you are a busy professional who would like to have his portfolio managed using our methodology, please contact me directly or get more details at:

https://theetfbully.com/personal-investment-management/

———————————————————

Back issues of the ETF/No Load Fund Tracker are available on the web at:

https://theetfbully.com/newsletter-archives/

ETF/No Load Fund Tracker Newsletter For Friday, July 6, 2012

Ulli ETF Tracker Contact

ETF/No Load Fund Tracker StatSheet

————————————————————-

THE LINK TO OUR CURRENT ETF/MUTUAL FUND STATSHEET IS:

https://theetfbully.com/2012/07/weekly-statsheet-for-the-etfno-load-fund-tracker-newsletter-updated-through-07052012/

————————————————————

Market Commentary

Friday, July 6, 2012

EQUITY MARKETS END LOWER AS JOB GROWTH DISAPPOINTS; ZROZ FLOATS, UNG LEAKS

US equities slumped Friday with the Dow Industrials and the S&P 500 finishing the week lower following a US Labor Department report that showed employers added fewer than estimated jobs in June.

Treasuries advanced for the second straight day as investors sought refuge in safe-haven assets in anticipation of another round of assets purchase by the Federal Reserve to boost a faltering job market.

The Dow Jones Industrial Average (DJIA) slipped 0.96 percent to end the day at 12,772.47, off 0.8 percent for the week. Only five of the 30 components within the blue-chip index ended in the positive region.

Ten year Treasuries capped the month on a high after jobs data showed employers added only 80,000 jobs in June, well short of the projected 100,000. Compared to 226,000 jobs a month in the first quarter, hiring in the second quarter dropped sharply to 75,000.

Read More

Weekly StatSheet For The ETF/No Load Fund Tracker Newsletter – Updated Through 07/05/2012

Ulli ETF StatSheet Contact

ETF/Mutual Fund Data updated through Thursday, July 5, 2012

If you are not familiar with some of the terminology used, please see the Glossary of Terms.


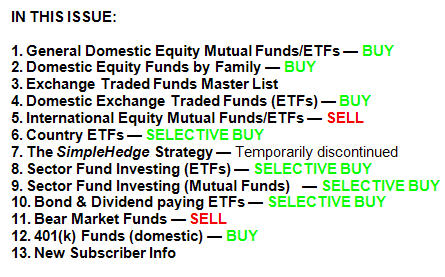
1. DOMESTIC EQUITY MUTUAL FUNDS/ETFs: BUY — since 10/25/2011

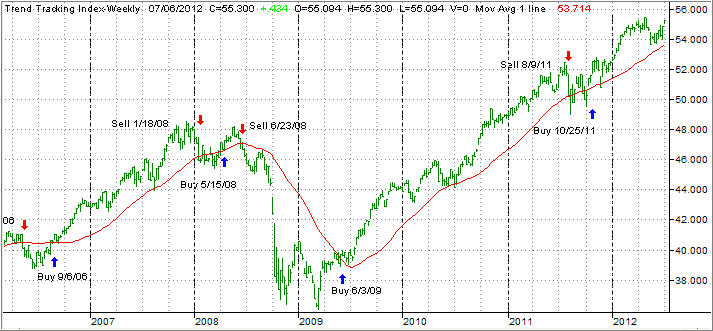
The domestic TTI broke through its long-term trend line generating a Sell for this area effective 8/9/2011. Over the recent past, we’ve seen the TTI hovering slightly below and above this dividing line between bullish and bearish territory. The clear break to the upside occurred on 10/24/11 and, effective 10/25/11, a new Buy signal for domestic equities went into effect.

As of today, our Trend Tracking Index (TTI—green line in above chart) has broken above its long term trend line (red) by +3.19%. A break back below it will generate a Sell signal to move out of all domestic equity positions. Be sure to tune into my blog for the latest updates.

Read More